Value zones
These are price levels (zones) that large Institutions recognise as representing value to buy or to sell at!
If price moves down into one of these levels - Institutions see this as a potential discounted buy level.
If price moves up into one of these levels - Institutions see this as a potential area to sell at a premium.
These levels don't disappear; they stay in the chart for years.
They aren't brick walls; they don't halt the price every time they're hit, but they do affect price most of the time.
Search for these on the daily chart only.
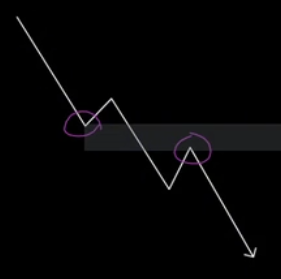
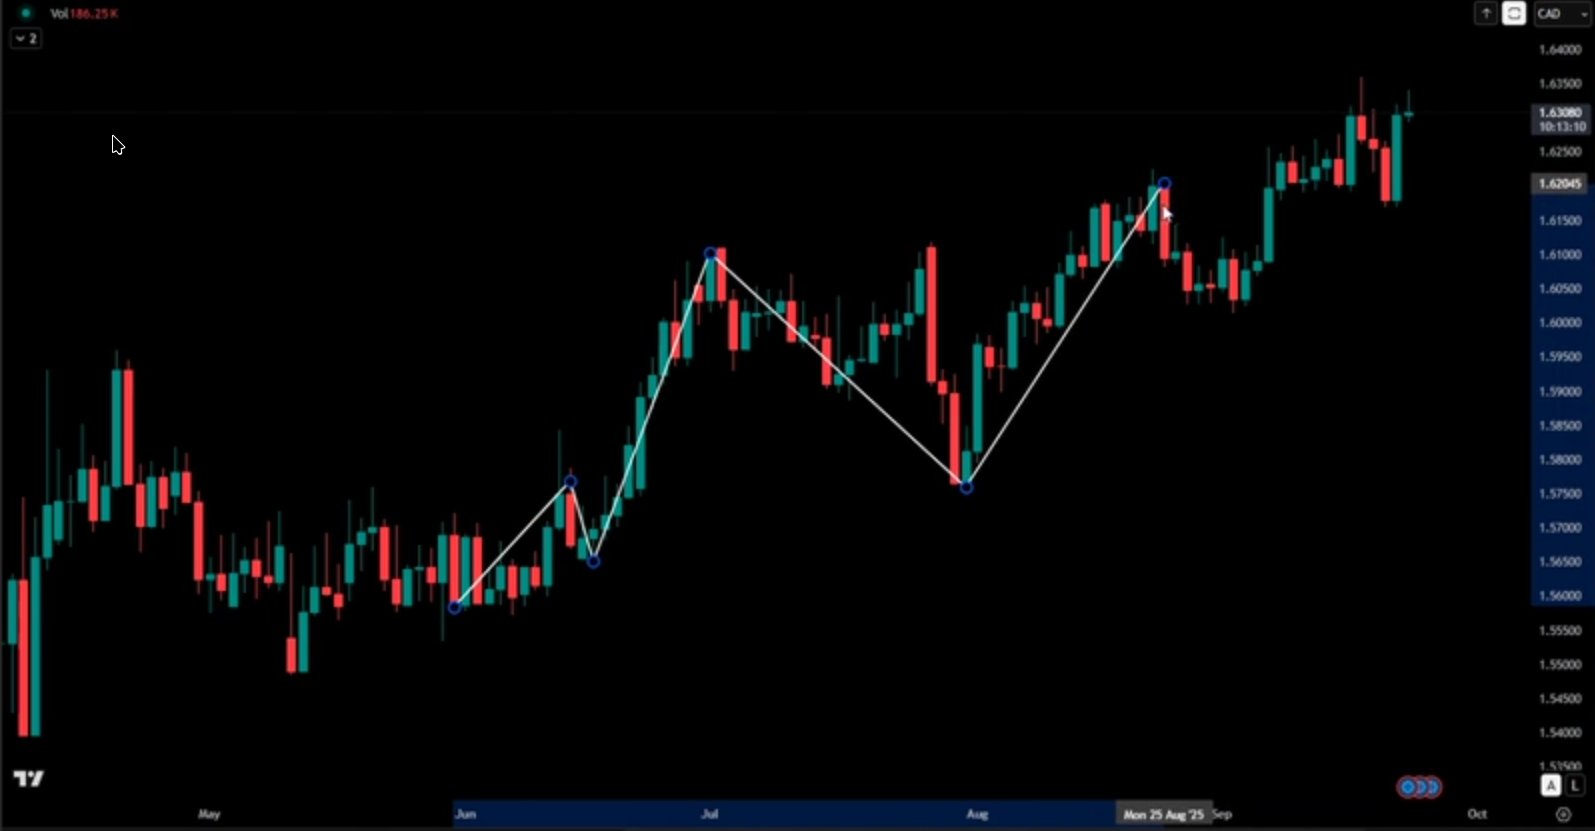
You want to see a price movement pattern like this (for a downtrend):
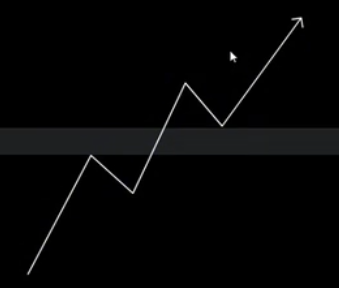
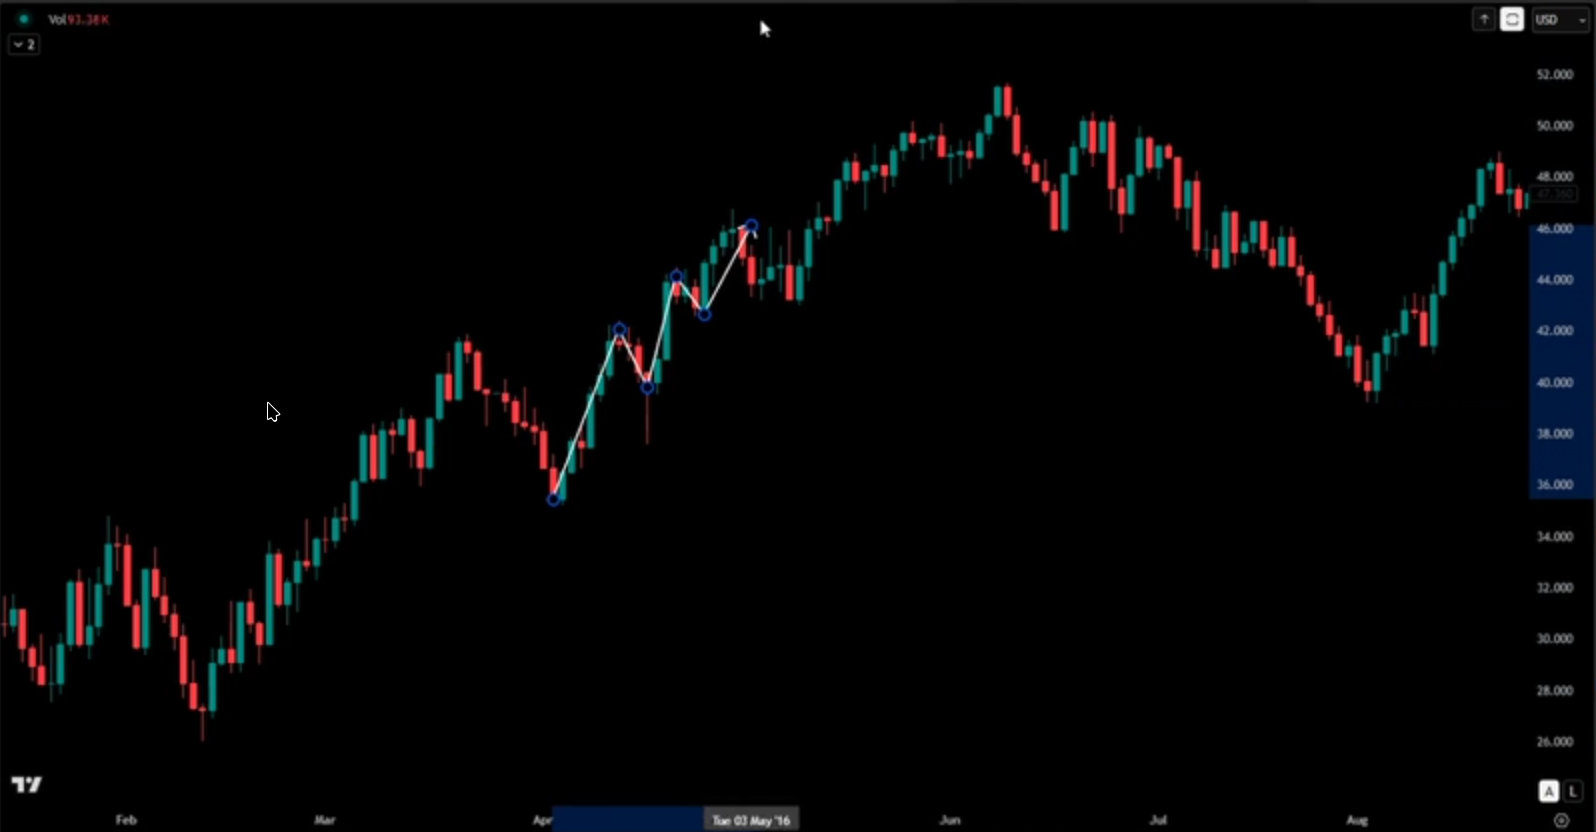
.. or like this in an uptrend:
Some rules:
- All 5 movements must be present and confirmed with price closes Each leg has to actually close higher/lower than the previous to be valid.
- There can't be any overlap between the pivot points.
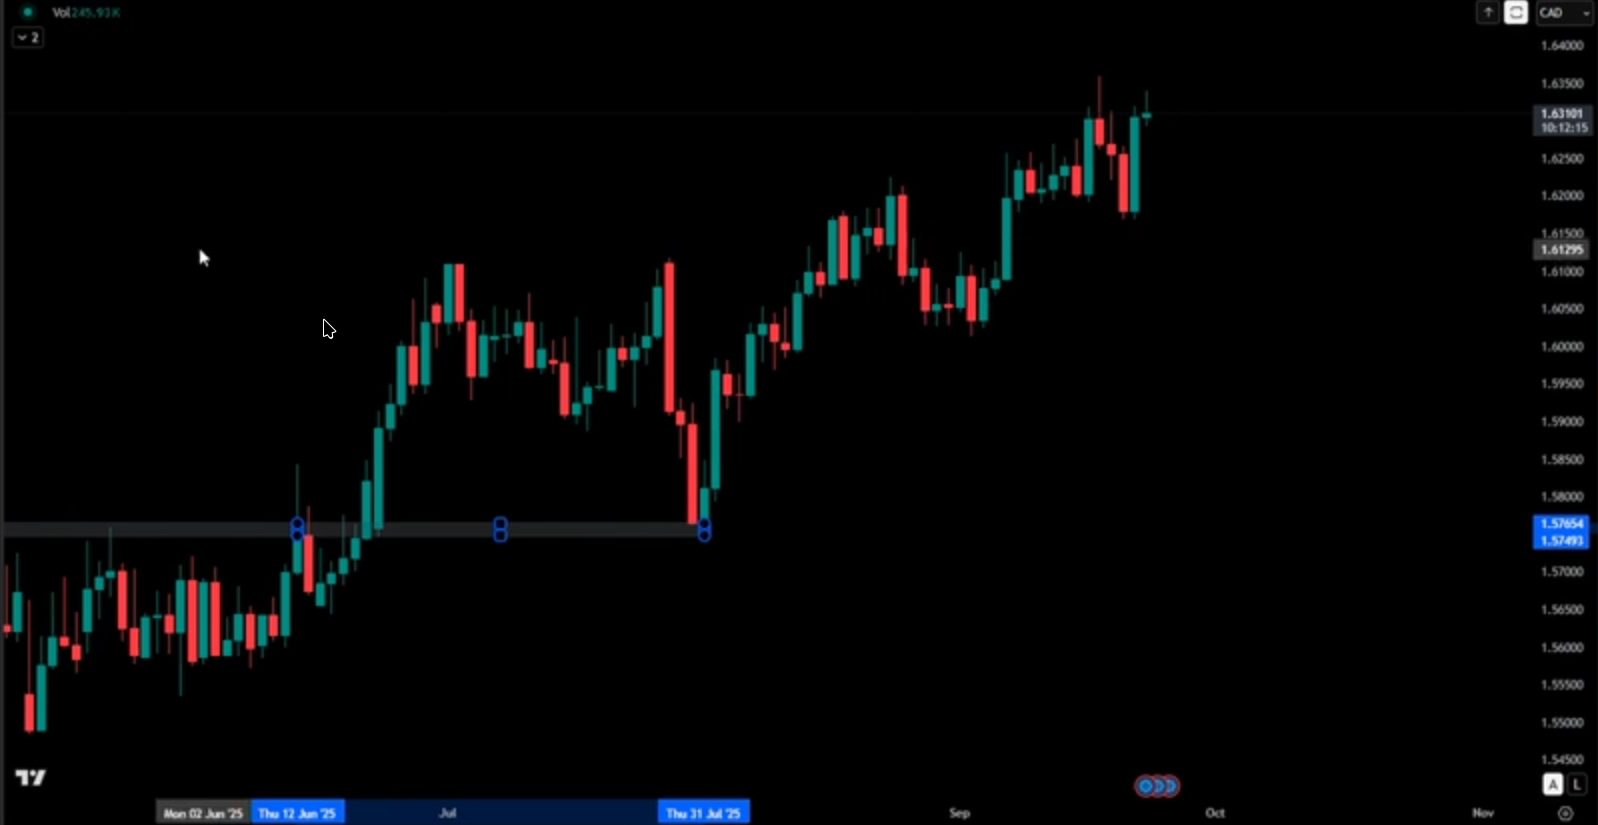
- Draw the zone from the body of the pull-back candle, to the body of, 2nd pull-back candle
- There should be some white space (at least one candle where no candles nor wicks are touching the zone), between the first pull back candle, to the push-through candle.
- Same whitespace rule after the push-through up to the 2nd pull-back and bounce
- Older zones can have their effect can be easily seen; newer zones have yet to prove themselves
- The zone should be quite short (not too high).
- For currency pairs, no more than 1.5% of the price. (The number in brackets in the ruler tool).
- For volatile currency pairs, like EUR/GBP, 1%
- For Indices, 2.5%
- For commodities, 3%
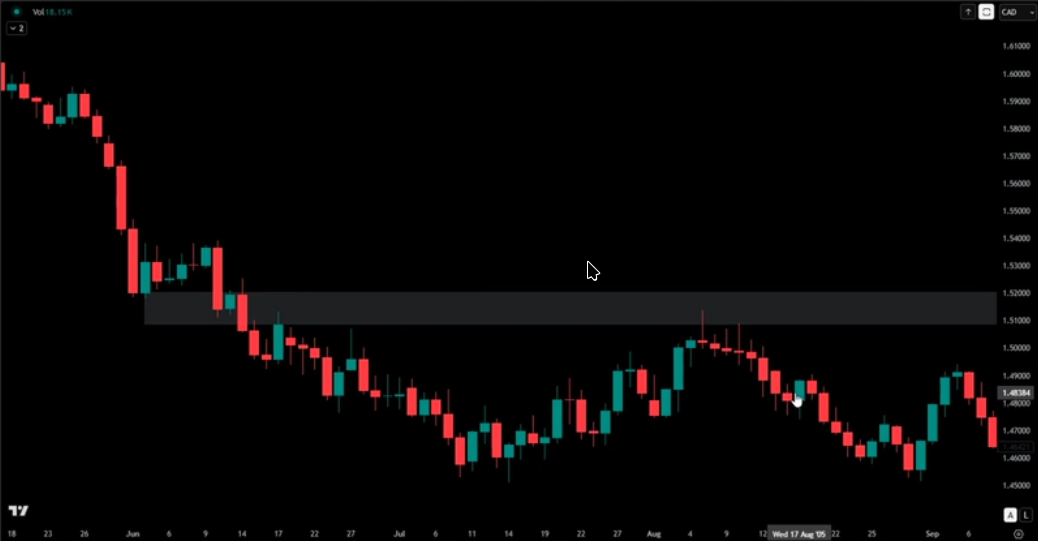
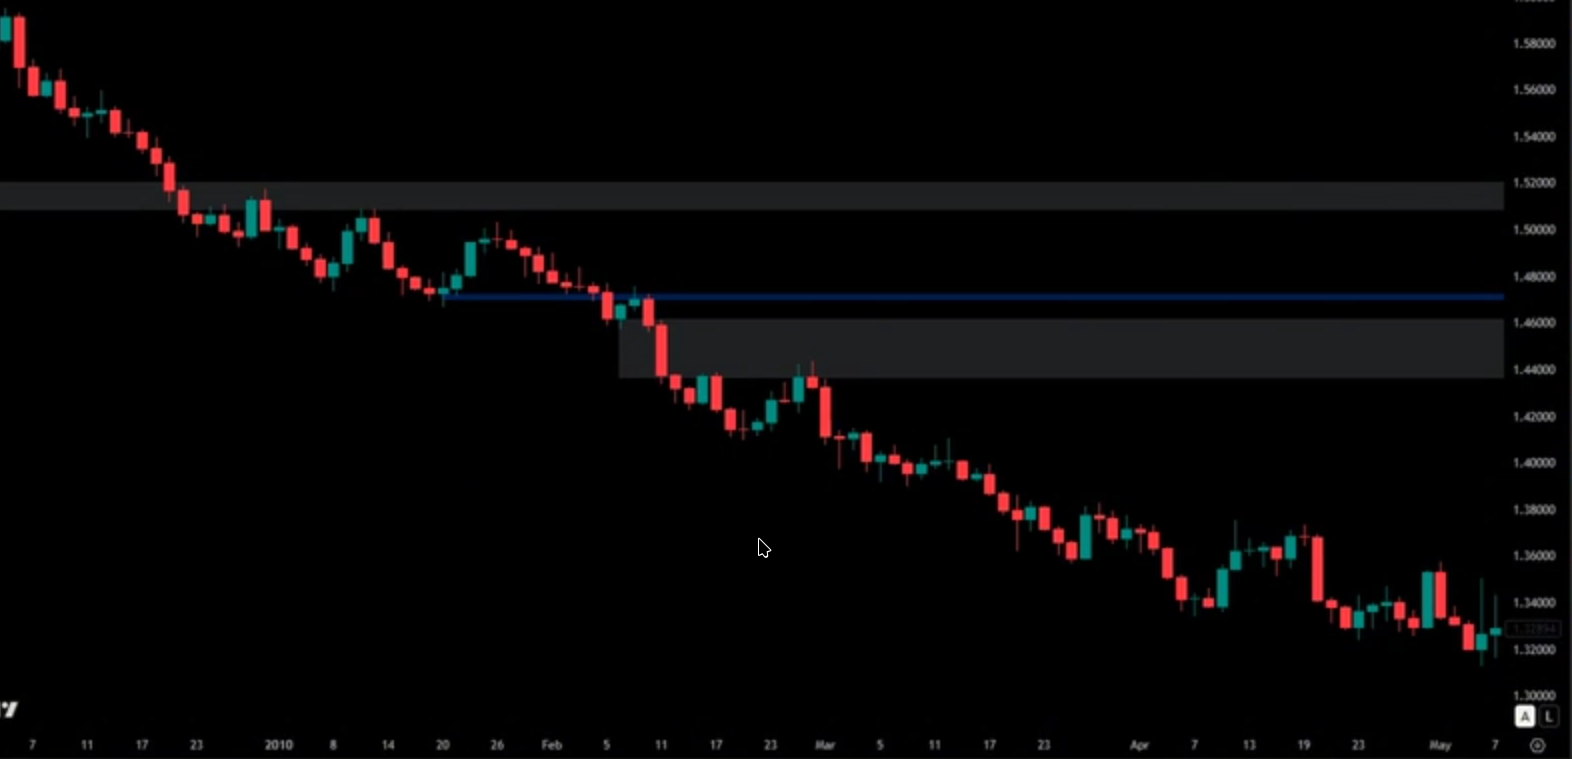
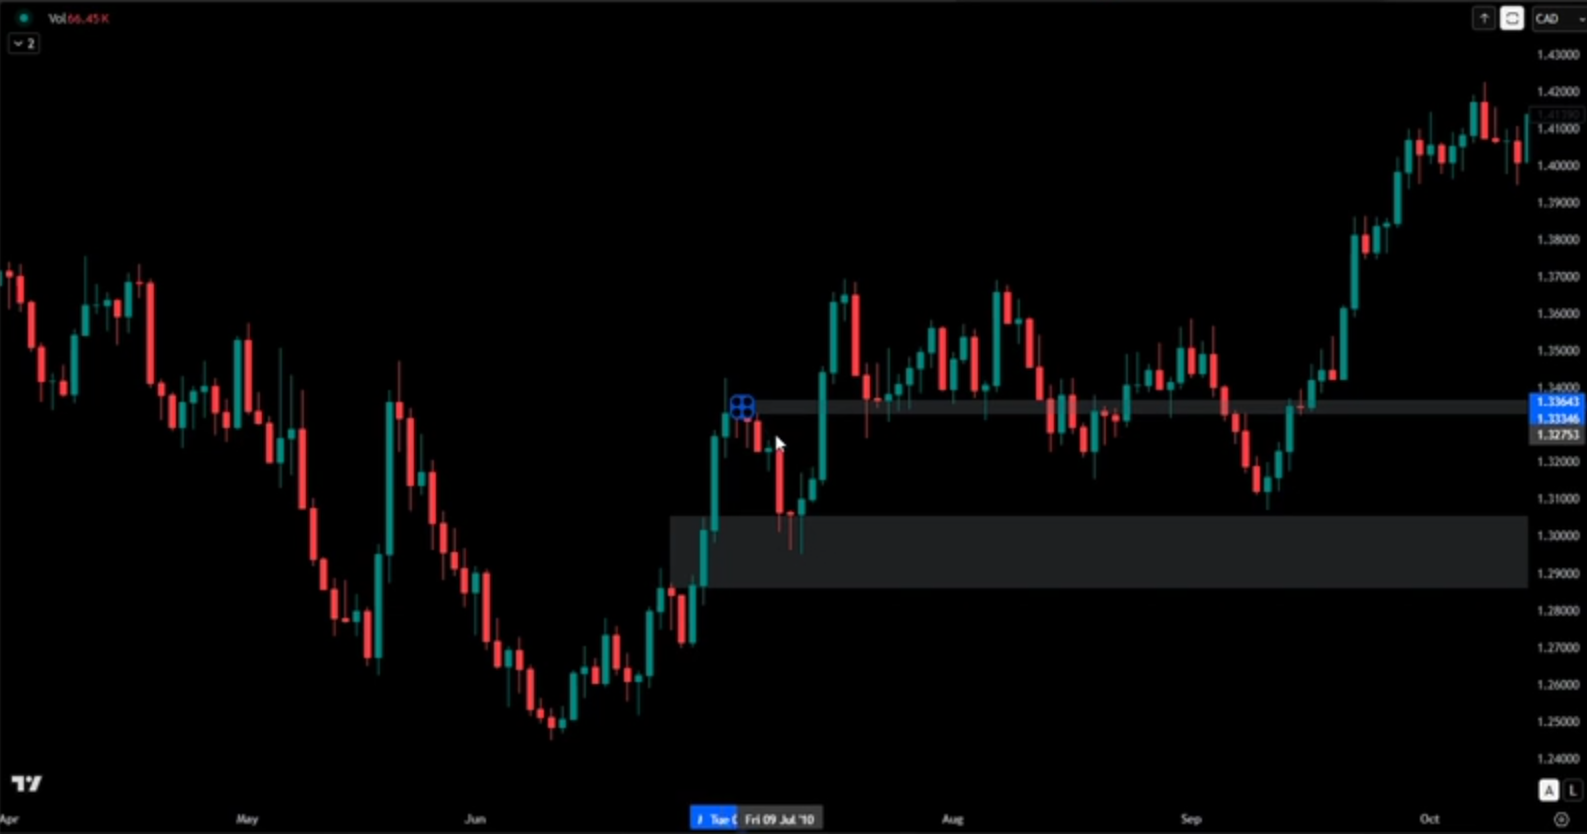
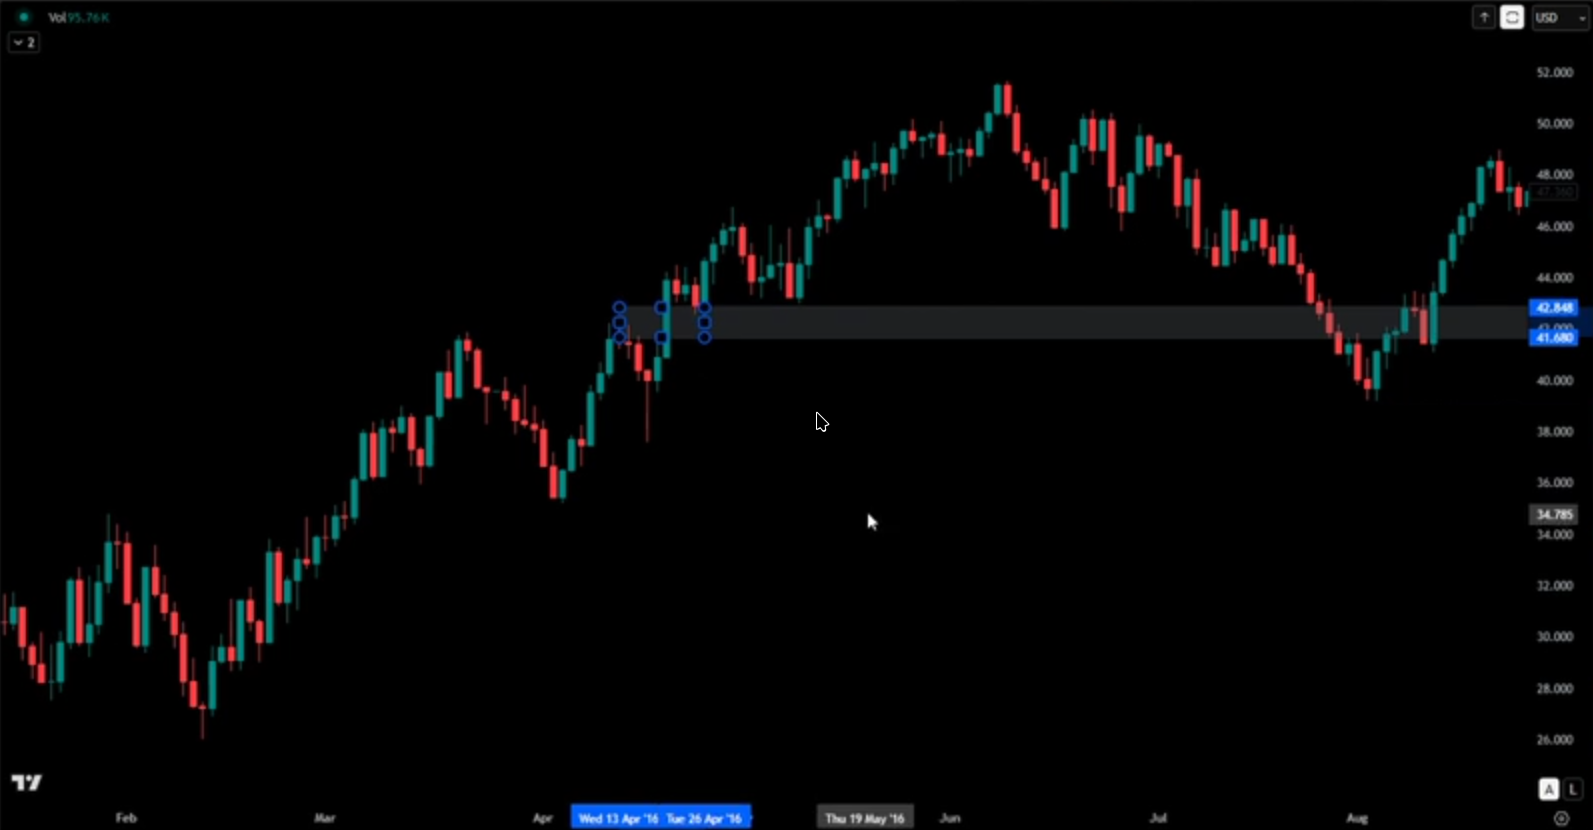
- After drawing the zone, we have to validate it. Note the sell-off as price hits the zone the 2nd time with just a big wick:
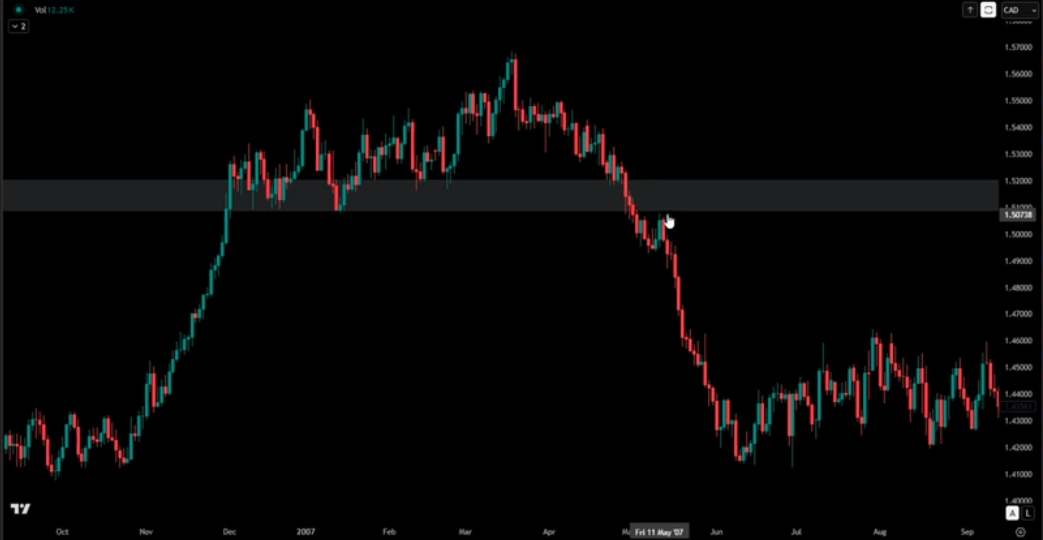
 That zone was drawn in 2005. Here in 2007 it's hit again. not that it pushes through, then bonces off it several times:
- If you find the zone is not respected, change its colour and mark it as "on-probation". Later, if it fails to continue respecting, remove it from the chart.
The top two zones are ok, but the bottom one is too tall. The bottom one is still respected but it's too tall to add value to our trades:
Invalid zone
The bottom zone is valid, but right on the limit of tallness.
The top zone is invalid, because the 2nd bounce-off doesn't go higher than the push-through run:
Funky zone
This zone's arrows look a bit extreme, but it is valid.
Because this zone is so new, we can't extend it right to validate it, so we extend it left instead.
US Oil example
Arrows
Draw
Validating
Looks to be well respected.
