W/M Reversal Trade Checklist
This mdBook captures the W Bottom and M Top reversal method as a concise pre-trade checklist. It encodes the hard rules from the "Tops Version 2.0" training so you can prepare charts, validate a setup, and place trades consistently.
Notes
- Use this as your single pre-trade routine. Do not skip steps.
- Where a term appears like Neckline or PCL, click through to the Terminology section for a crisp definition.
- When you see an image marker like [10:24], it indicates a timestamp in the source video where a visual example is shown. See TRANSCRIPT-TO-BOOK for how images are extracted.
Scope
- Timeframes: primarily
H1andH4. Do not trade belowH1for this method. - Instruments: FX, indices, commodities, stocks; crypto with caution.
Trade Checklist: W Bottoms and M Tops
Use this end-to-end checklist to take a single high-probability W Bottom / M Top trade. Follow every step. Terms in the checklist link to the Glossary for detailed definitions.
- Timeframes: trade on
H1orH4only. Do not go belowH1. - Instruments: FX, indices, commodities, stocks. Crypto with extra caution.
1) Pre-Trade Safety: Economic News Filter [10:24]
- Filter calendar for relevant two-star/orange and three-star/red events.
- H1 rules:
- Do not take trades within 8 hours of a relevant three-star event.
- Two-star events can generally be ignored on H1+ (they get "soaked up" by the larger timeframe).
- Exception: if a two-star event is a current "hot topic" (e.g., inflation data during high-inflation periods), treat it like a three-star.
- H4 rules:
- Same as H1: avoid within 8 hours of three-star events.
- Ignore two-star events unless they're hot-topic related.
- USD three-star events affect virtually everything - not just USD pairs. If there's a big US release coming, it will likely affect all currency pairs, commodities, and indexes.
- EUR events often affect GBP and CHF as well (they're correlated).
- If a relevant three-star release is imminent and you have open trades → close them (profit or loss). Spreads widen and slippage is common. [11:20]
2) Prepare Chart: Weekly Trend Lines [18:29]
- Open a weekly chart, zoom out 10–20 years if available. [18:59]
- Draw trend lines through the most obvious pivot highs and pivot lows; extend to the right. [19:30]
- Rule: if any weekly trend line lies between your planned entry and Pattern Completion Level (PCL), pass the trade. [23:17]
3) Identify Candidate W/M Pattern
- Structure: an impulsive move, a pullback, and a second test to a similar level (tops for M, bottoms for W). [32:30]
- Pullback depth: the lowest/highest body of the pullback should not exceed 40% of the preceding impulsive move; 50% is a hard maximum. If >40% generally pass. [29:30]
- Rogue wicks: you may ignore at most one obvious rogue wick per side of the pattern. [35:00]
4) Draw the Neckline [33:00]
- M Top: draw a horizontal line at the lowest body of any candle between the left and right highs.
- W Bottom: draw a horizontal line at the highest body of any candle between the left and right lows. [33:00-36:00]
5) Validate Correct Timeframe (Candle Count) [51:40]
- From the neckline price level, move left until you meet a candle body: that is candle #1.
- Count forward until the first candle breaks the neckline; that is the last candle.
- Valid count: 7 to 30 candles inclusive. [51:40]
- If ≤6 candles, go down one timeframe (but never below H1); reassess the whole setup.
- If >30 candles, go up one timeframe; reassess from Step 3.
6) Define Entry Level (Pending or Market) [57:22][09:15]
- Charts show the mid price (halfway between bid and ask). Entry rules account for half-spread adjustments.
- W Bottom (long): entry = neckline + 0.5 pip + half spread (you buy at ask = mid + half spread). [09:15]
- M Top (short): entry = neckline − 0.5 pip − half spread (you sell at bid = mid - half spread). [57:22]
- Set a pending order (buy stop for W, sell stop for M) at the computed level; or set an alert just before the neckline and place a market order on the break.
- Do not wait for a retest; these patterns often go straight to target after the break. [57:20]
7) Place the Stop Loss (SL) [23:11-24:35]
- W Bottom (long): SL = 1 pip below the selected swing low − half spread (SL triggers when bid hits level = mid - half spread). You may ignore one rogue wick. [23:11]
- M Top (short): SL = 1 pip above the selected swing high + half spread (SL triggers when ask hits level = mid + half spread). [24:00-24:35]
- Minimum SL requirement: SL distance must be ≥ 10× broker spread. See Risk Management.
8) Compute Pattern Completion Level (PCL) and Take Profit (TP) [39:14]
- Measure vertically from neckline to SL distance (in pips). This is 1R. [39:14]
- Project the same distance from the neckline in the trade direction; draw a horizontal line. This is the PCL. [39:20-40:20]
- Validate PCL: extend a horizontal line left; it should intersect the bodies of the prior impulsive move. If it does not, pass the setup. [42:10-43:10]
- TP plan (mid-price charts require half-spread adjustments):
- W Bottom (long): TP = PCL − half spread (TP triggers when bid hits level = mid - half spread).
- M Top (short): TP = PCL + half spread (TP triggers when ask hits level = mid + half spread).
- This ensures the trade achieves true 1:1 R:R after accounting for spread on both entry and exit. [43:40]
- Optional scaling: if an Inefficient Candle exists beyond PCL, consider taking partial profits at PCL and let a remainder run to its Square-Up Level. [1:27:30]
9) Roadblocks Check: Trend Lines and Inefficiencies [22:45][1:27:00]
- Weekly trend line between entry and PCL → pass the trade. [23:17]
- Inefficient candle square-up between entry and PCL:
- If very close to entry, high risk of immediate reversal → pass. [1:39:10]
- If beyond PCL, you may aim TP to PCL only (1:1 often sufficient), optionally manage a runner to square-up. [1:44:10]
- Convert obstacle distance to R-multiple:
distance_pips ÷ 1R. If <1.0R, treat as material roadblock.
10) Position Sizing and Orders [14:00-16:00]
- Risk per trade: 0.5%–2.0% of account; 1% is a common default. Use a position size calculator with your SL distance. [10:10-10:30]
- Enter order details precisely: entry, SL, TP, volume. Double-check spread adjustments per pattern direction.
- See Risk Management for full details.
11) Final Sanity Checks
- News window safe? [Section 1]
- Candle count valid (7–30) and timeframe confirmed? [Section 5]
- Neckline and PCL validated against prior impulsive bodies? [Sections 4, 8]
- No weekly trend line blocking path? [Section 2]
- Roadblocks understood and plan set (partial TP or pass)? [Section 9]
12) Manage and Exit
- On imminent relevant three-star news → exit open trades; do not rely on stops (slippage/spreads). See Manual Close. [11:20]
- If price stalls at a known roadblock near entry, consider invalidating or reducing risk per your plan. [1:55:00]
- Otherwise, let the trade work; avoid emotional changes to SL/TP.
- See Manual Close Conditions for rule-based discretionary exits.
Ultra-Compact Checklist
- News safe window confirmed (H1/H4: 8h from 3-star; USD 3-star affects everything)
- Weekly trend lines plotted; none block entry→PCL
- Valid W/M structure; pullback ≤40% of impulse; rogue wicks ≤1/side
- Neckline correct; candle count 7–30 on chosen TF
- Entry set (W: NL+0.5+half spread; M: NL−0.5−half spread)
- SL set (W: 1 pip below low − half spread; M: 1 pip above high + half spread)
- PCL measured (NL↔SL) and validated on prior bodies
- TP at PCL adjusted (W: PCL−half spread; M: PCL+half spread); plan for inefficiency runner if applicable
- Position size calculated (risk 0.5–2%) and order placed
- Recheck news before triggering; manage per plan
M & W Printable Trade Checklist
Print and fill in with a pen. Every gate must pass before moving to the next section.
Date: __________ Instrument: ________________ TF: ______ Direction: ☐ LONG (W) ☐ SHORT (M)
Section 0 — Psychological Check
Answer before looking at any chart. Any red-flag answer = stop, walk away.
| Question | Answer | |
|---|---|---|
| ☐ | Do you feel relaxed? | ☐ Yes ☐ No → STOP |
| ☐ | Do you feel scared? | ☐ No ☐ Yes → STOP |
| ☐ | Feeling like you haven't traded enough this week? | ☐ No ☐ Yes → STOP |
| ☐ | Feeling like you've taken too many trades today? | ☐ No ☐ Yes → STOP |
Tick each box only once you've answered honestly. All must pass.
Part 1 — Pattern Valid?
| Rule | |
|---|---|
| ☐ | Valid W/M structure: impulsive move → pullback ≤40% → second test |
| ☐ | At most 1 rogue wick per side |
| ☐ | Candle count 7–30 on this timeframe |
| ☐ | Neckline correct: lowest body (M) / highest body (W) |
| ☐ | PCL validated: horizontal line intersects prior impulsive bodies |
| ☐ | MFI divergence present |
| ☐ | No weekly trend line between entry and PCL |
PCL: __________ Neckline: __________
Part 2 — Conditions OK?
| Rule | |
|---|---|
| ☐ | No 3-star news within 8h (USD 3-star affects all instruments) |
| ☐ | Not in spread hour (21:55–23:05 UK / 07:00–09:00 AEST) |
| ☐ | Not Friday afternoon (H1 and below) |
| ☐ | No strong roadblock between entry and PCL (roadblock < 1R = fail) |
| ☐ | Break candle ≥ 1 ATR (golden candle) |
| ☐ | R:R ≥ 1:1 after any roadblock adjustment |
ATR: __________ Break candle size: __________ R:R: __________
Part 3 — Trade Levels
Entry: __________ SL: __________ TP: __________ Position size: __________
| Rule | |
|---|---|
| ☐ | Entry = NL ± 0.5 pip ± half spread |
| ☐ | SL = 1 pip beyond swing extreme ± half spread; distance ≥ 10× spread |
| ☐ | TP = PCL ± half spread |
| ☐ | Position size 0.5–2% risk |
Part 4 — EFI Extension (optional — skip if not using EFI)
| Rule | |
|---|---|
| ☐ | No strong roadblock between PCL and EFI target |
| ☐ | 2-EMA Elder Force Index is in trade direction at entry |
| ☐ | Plan set: close 50% at TP, let remainder run until EFI reverses |
Part 5 — Commitment
I will not close early unless one of the 5 exit rules triggers:
| Exit rule | |
|---|---|
| ☐ | 1. Price moves sideways for same candle count as pattern formation |
| ☐ | 2. High-impact news event approaching |
| ☐ | 3. Within 50 pips of SL before spread hour |
| ☐ | 4. Friday close (H1 and below) |
| ☐ | 5. Price hits S/R with a strong reversal candle against position |
I accept this trade may hit SL — that is a valid outcome. ☐ Agreed
After the Trade
| ☐ | Journal entry created |
| ☐ | Spreadsheets updated (trade-data + all-trades) |
Outcome: __________ Notes: ___________________________________________________
Extended M and W Patterns (EMA Method)
This strategy targets M and W patterns that form when price is extended away from the moving averages. The EMAs act as "magnets" pulling price back, giving these setups a higher probability of reaching target.
Setup Requirements
EMAs to Use
Plot these three Exponential Moving Averages:
- 50 EMA
- 100 EMA
- 200 EMA
In TradingView, use the "Moving Average Ribbon" indicator and change from SMA to EMA in settings.
Valid Setup Criteria
- Price must be extended away from ALL three EMAs - not touching or near any of them
- A valid M top or W bottom pattern forms in this extended area
- The Pattern Completion Level (PCL) should be near or past the nearest EMA (usually the 50 EMA)
Target and Stop Loss
Target
- The nearest EMA (typically the 50 EMA)
- As each new candle forms, the EMAs move - adjust your take profit accordingly
Stop Loss
- Standard M/W stop loss rules apply (below the W low or above the M high)
Risk:Reward
- Minimum 1:1 R:R required - if the setup doesn't offer at least 1:1, pass the trade
Trade Management
The 90% Rule
If price reaches 90% of your target and shows a reversal candle (pin bar or engulfer):
- Close the trade manually
- Don't wait for the full target
- A 0.9R win is better than watching it reverse to a loss
Adjusting Take Profit
Because EMAs move with each new candle:
- Recalculate your TP after each candle close
- The 50 EMA may shift toward or away from current price
- This is especially important on longer trades
Advantages of Extended M/W Trades
The EMA "pull power" makes these setups:
- Less sensitive to news events - the magnetic pull often overrides short-term news reactions
- Less sensitive to roadblocks - minor resistance/support levels matter less when price is far from the EMAs
- Higher probability of reaching target - extended price has a strong tendency to return to the mean
When to Use This Method
Use Extended M/W when:
- Price has made a strong impulsive move away from the EMAs
- All three EMAs (50, 100, 200) are clearly below price (for M top) or above price (for W bottom)
- The PCL aligns with or exceeds the nearest EMA level
Checklist: Extended M and W
- Plot 50, 100, 200 EMAs on chart
- Price is extended away from ALL EMAs
- Valid M or W pattern forming
- PCL reaches or passes the nearest EMA (usually 50)
- Risk:Reward is at least 1:1
- Set TP at nearest EMA level
- Adjust TP as EMAs move with each candle
- Apply 90% rule if reversal candle appears near target
Trade Checklist: Head and Shoulders
For inverted head and shoulders, just do everything here upside down.
Use this end-to-end checklist to plan and execute a single high-probability Head and Shoulders short. Follow every step. Terms link to the Glossary and supporting modules.
- Timeframes: trade between
M15andDaily. Weekly is the absolute max; never go belowM15. - Instruments: FX majors/minors, indices, commodities, selected stocks. Crypto requires extra caution and wider spreads.
1) Pre-Trade Safety: Economic News Filter news.md
- Filter a reliable calendar for the instrument you plan to trade; include central-bank decisions, CPI, NFP, and earnings.
- 15-min setups: block trades within 3 hours of any relevant two- or three-star release.
- H1/H4 FX: focus on three-star/red events; build an 8-hour no-trade window before/after the release. Two-star events can generally be ignored on H1+ (they get "soaked up" by the larger timeframe). Exception: if a two-star is a current "hot topic" (e.g., inflation), treat it like three-star.
- Stocks (H1/H4): avoid trades 48 hours before/after earnings for the underlying company or sector bellwethers.
- USD three-star events affect virtually everything - not just USD pairs. If there's a big US release coming, it will likely affect all currency pairs, commodities, and indexes.
- EUR events often affect GBP and CHF as well (they're correlated).
- When a significant release is approaching and you are already in a trade, follow the manual-close rule: flatten before the event—spreads will widen and slippage is common.
2) Prepare Chart: Weekly Trend Lines & Macro Roadblocks (roadblocks.md)
- Open a weekly chart, zoom out 10–20 years, and draw all meaningful trend lines through pivot highs/lows; extend them to the right.
- If any weekly trend line sits between your intended entry and Pattern Completion Level (PCL), skip the trade.
- While on the higher timeframe, note historical support/resistance zones that have produced multiple reversals; mark them for Step 12.
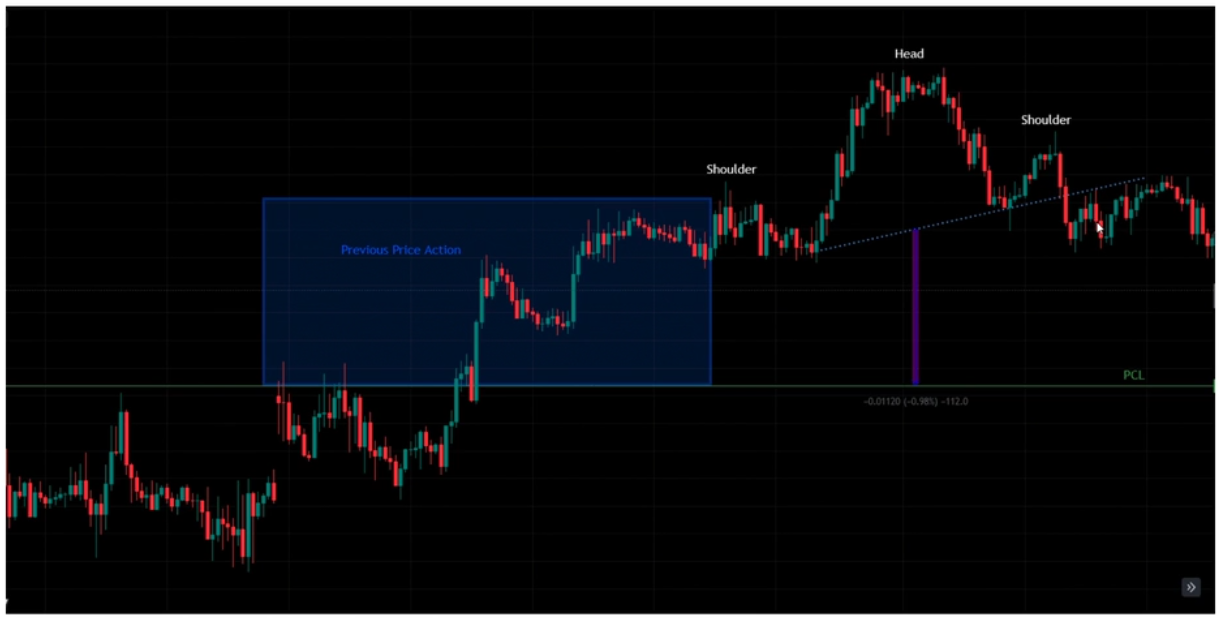
3) Assess Previous Price Action (ppa.md)
- Define the PPA window: from the projected PCL up to the start of the left shoulder.
- Confirm you have a decisive, clean bullish impulse leading into the head. Choppy or sideways action weakens the pattern—walk away if price meanders.
- Map historical support and resistance between the neckline and PCL; each level with ≥3 touches (acting as both support and resistance) is high risk.
- Identify any inefficient candles in the target path. Large unsquared candles beyond the neckline often act as magnets; those sitting between entry and target can become roadblocks.
4) Confirm Pattern Structure (entry-signal.md)
- Sequence must read: higher highs/higher lows into the head, followed by a lower high (right shoulder). If price prints a high above the head, the setup is invalid.
- Shoulders should be broadly symmetrical; if a new higher shoulder forms after the right shoulder, redraw the neckline and reassess from scratch.
- Reject setups showing conspicuous anti-entry patterns (e.g., bullish pin bars) immediately before the bearish entry signal.
- Only one obvious rogue wick per shoulder can be ignored; otherwise treat it as noise and pass.
5) Validate Timeframe and Candle Count (appropriate-time-frame.md)
- Anchor at the bottom of each shoulder body: extend a horizontal line left to find candle #1; extend through the right shoulder body to mark the last candle before the break.
- Count bodies between those anchors; acceptable lengths:
M15&H1: 30–120 candlesH4: 30–180 candlesDaily: 30–210 candles
- Too few candles → drop one timeframe (never below
M15). Too many → step up one timeframe and reassess the entire pattern.
6) Draw and Validate the Neckline
- Connect the lows of the left and right shoulders with a horizontal or gently sloping line; extend it right.
- Confirm the neckline runs through candle bodies, not wicks. If you must cut through multiple bodies, the pattern is sloppy—pass.
Break of Structure Requirement (Personal Theory)
Note: This rule is a personal theory developed from analysing my own trade results, not from the course instructor. Use at your own discretion.
There must be a Break of Structure (BOS) before entering the trade.
For H&S short, BOS means a lower low. This can be achieved by:
- The right neckline anchor point being lower than the left (Quasimodo - favourable neckline), OR
- The break and close being lower than the right neckline anchor point (acceptable), OR
- The break and close being lower than both neckline anchor points (ideal)
For iH&S long, BOS means a higher high. This can be achieved by:
- The right neckline anchor point being higher than the left (Quasimodo - favourable neckline), OR
- The break and close being higher than the right neckline anchor point (acceptable), OR
- The break and close being higher than both neckline anchor points (ideal)
The Ideal Trade (H&S Short Example)
The best H&S short setup has:
- Break and close below BOTH neckline anchor points - confirms BOS
- Strong, forceful retest that pushes back above the neckline but stays below the right shoulder - creates a lower high
- Entry candle appears immediately after the retest - shows conviction
Ideal H&S Short:

     Head
      /\
     /  \
    /    \    Right Shoulder (lower high)
   /      \      /\
  /   Left \    /  \    ← Retest (below shoulder, above neckline)
 /   Shoulder\  /    \
/      /\     \/      \
      /  \             \
─────/────\─────────────\──── Left NL anchor
            ─────────────\─── Right NL anchor
                          \
                           \  ← Break & close below BOTH anchors (BOS)
                            \
                             → Entry candle after retest
Grading System
| Grade | H&S Short Criteria | iH&S Long Criteria |
|---|---|---|
| Grade A | Right anchor lower than left (Quasimodo) OR break below both anchors | Right anchor higher than left (Quasimodo) OR break above both anchors |
| Grade B | Break below right anchor only | Break above right anchor only |
| Eliminate | No BOS - right anchor and break both higher than left | No BOS - right anchor and break both lower than left |
Grade B Requirements
If the break only clears the right neckline level (Grade B), require BOTH:
- A strong retest - forceful move back that still produces a lower high (H&S) or higher low (iH&S)
- A strong entry candle - large body, decisive close, appearing immediately after the retest
Elimination Rules
Eliminate (do not trade) if:
- No BOS - right anchor and break are both on the wrong side of the left anchor
- Consolidation forming - the H&S pattern formed with strong, forceful waves, but after the break price action changes into weak, choppy consolidation rather than continuing with momentum
If there is no BOS, pass the trade.
7) Wait for Break, Close, Retest (bcr.md)
- Do not plan an entry until price breaks, closes beyond, and retests the neckline.
- Retest must at least touch the neckline; deeper retests that stay below the right shoulder high are acceptable and improve R:R.
- If price tags the projected PCL before the retest, the pattern is invalid for trading purposes.
8) Confirm Entry Setup Candle (entry-signal.md)
- After the retest, require one of the approved bearish setups: pin bar, engulfing candle, or tweezers satisfying the module rules (body ≤50%, wick orientation, engulfing close ≥75%/≤25%, etc.).
- If a bullish candle closes above the bearish setup before you enter, that setup is invalid—wait for a new pattern or skip the trade.
- Multiple valid bearish setups clustered near the retest add confluence; still pick the cleanest one for measurement.
9) Define Entry Level (entering-the-trade.md)
- Default: place a sell-stop just below the low of the confirmed setup candle − half spread (you sell at bid = mid - half spread); market entries are acceptable only if you can execute immediately on a neckline break.
- For inverted H&S (long): entry = just above setup candle high + half spread (you buy at ask = mid + half spread).
- Record entry, neckline level, and spread in your journal; charts display mid price (halfway between bid and ask).
10) Place the Stop Loss (SL)
- Choose your protection style:
- Conservative: just above the head
- Aggressive: just above the right shoulder
- Super aggressive: just above the setup candle
- H&S short: add half spread to SL (SL triggers when ask hits level = mid + half spread).
- Inverted H&S long: subtract half spread from SL (SL triggers when bid hits level = mid - half spread).
- Ensure the SL distance still delivers positive R:R (>1:1). If even the super-aggressive SL yields <1R to target, skip the trade.
11) Compute PCL and Take Profit (pattern-completion-level.md, sl-and-tp.md)
- Measure vertically from the head high (body; you may ignore one rogue wick) down to the neckline: that is
1R. - Project the same distance below the neckline to plot the PCL. Draw a horizontal line and extend it left to confirm price has previously traded that zone via candle bodies; if not, ditch the setup.
- H&S short: Set TP = PCL + half spread (TP triggers when ask hits level = mid + half spread).
- Inverted H&S long: Set TP = PCL − half spread (TP triggers when bid hits level = mid - half spread).
- If a strong S/R zone sits closer than PCL yet still yields ≥1R, target that level instead.
12) Roadblocks & Inefficiencies Review (roadblocks.md, ppa.md)
- Re-check weekly trend lines plus intra-timeframe horizontal S/R between entry and TP; any level within <1R distance must be treated as a roadblock.
- Identify inefficient candles between entry and PCL. If one is very near entry there is high reversal risk → pass; if it lies beyond PCL, plan optional partials at PCL and a runner toward the inefficient candle’s midpoint.
13) Position Sizing and Orders (entering-the-trade.md)
- Risk ≤1% per trade (0.25% recommended for newer traders). Use a position-size calculator with the precise SL distance (including spread).
- Fill in order ticket: entry, SL, TP, volume. Save screenshots/notes for journaling before the trade triggers.
14) Final Sanity Checks
- News blackout window confirmed? (Section 1)
- Weekly TL / major S&R clear between entry and TP? (Sections 2 & 12)
- Clean impulse into the pattern and acceptable candle count? (Sections 3 & 5)
- Neckline, BCR, and entry candle validated? (Sections 6–8)
- SL, TP, and R:R double-checked with spread adjustments? (Sections 10–11)
- Orders placed and journal updated? (Section 13)
15) Manage and Exit (letting-the-trade-run.md, when-to-manually-close-the-trade.md)
- After entry, step back: double-check SL/TP once, reassess roadblocks, then leave the trade alone.
- Track the "x-candle" timeout: count the candles spanning the neckline between the shoulders; if the live trade prints
xcandles after the break without touching TP or SL, close it manually. - Close trades ahead of high-impact news (Section 1), during the spread hour if price sits within ~50 pips of SL, or before weekends on sub-H4 setups.
- If price stalls at a pre-identified S/R level, move SL to breakeven, watch 1–3 candles, and exit on strong rejection.
16) Divergence Confluence (divergence.md)
- Monitor oscillators such as RSI for divergence: when the indicator posts higher highs/lows while price makes the opposite, momentum is fading.
- Classify the signal (regular vs. hidden); both are valid, but hidden divergence can mark continuations inside the shoulder structure.
- A bearish divergence that stretches into the head adds confidence to the short; the longer the window and the farther apart price/oscillator peaks end, the stronger the signal.
- If divergence is meaningful, note it explicitly in the checklist/journal and consider scaling risk modestly (still within the 1% cap).
- Keep studying the Academy divergence module/video so the pattern recognition stays sharp.
17) Inefficient Candle Plan (inefficient-candles.md)
- Flag any oversized candle that has not been squared up (price never revisited its 50% level). The candle before or after it can perform the square-up.
- When an unsquared candle sits a little beyond your PCL, consider nudging the take-profit closer to its midpoint to capture the magnet effect without overreaching.
- Treat unsquared inefficiencies as targets that can extend R:R, but only if intervening resistance levels stay clear; roadblocks ahead still cap the trade.
- Never push TP past an identified resistance/support just to chase the inefficient candle—consistent execution beats squeezing every pip.
Ultra-Compact Checklist
- News window clear (3h on M15; 8h on H1/H4 FX; 48h pre-earnings for stocks; USD 3-star affects everything)
- Weekly trend lines + PPA assessed; no blocking S/R between entry↔PCL
- Valid H&S anatomy (lower right shoulder, no highs above head) with correct candle count
- Neckline drawn and direction assessed (if against trade → require strong BCR + convincing entry candle)
- BCR complete; approved bearish setup printed
- Entry = setup low − half spread (short) or setup high + half spread (long)
- SL above head/shoulder + half spread (short) or below + half spread subtracted (long)
- TP = PCL + half spread (short) or PCL − half spread (long); or nearer S/R ≥1R
- Roadblocks and inefficient candles reviewed; positive R:R confirmed
- Position size ≤1% risk, orders staged, journal updated
- Management plan ready: x-candle timeout, news/spread/ weekend rules respected
Glossary
Comprehensive terminology for W/M reversal trading. Terms are arranged alphabetically.
ATR (Average True Range)
A volatility indicator measuring the average range of price movement over a specified period. Used to scale expected hold windows and assess instrument volatility.
Bid/Ask Spread
The difference between the bid price (where you can sell) and ask price (where you can buy). Forex charts typically show bid prices, which affects entry and stop placement rules differently for longs vs shorts.
Broker Spread
The cost charged by your broker, measured in pips, between the bid and ask price. Critical for validating minimum stop loss sizes (must be ≥10× spread).
Candle Body
The rectangular portion of a candlestick between the open and close prices, excluding the wicks. Used for neckline placement and pullback depth measurements.
Candle Count
The number of candles from the first candle body that aligns with the neckline level to the candle that breaks the neckline. Valid range: 7–30 candles inclusive.
Divergence
When price makes a higher high (for M) or lower low (for W) while an oscillator (like RSI) makes a lower high or higher low at the same swing points. Used only as confluence, never as a standalone entry signal.
Economic News Filter
Time-based rules to avoid trading near high-impact economic releases:
- H1 timeframe: No entry within 3h of relevant 3-star/red events; no entry within 2h of relevant 2-star/orange events
- H4 timeframe: Ignore most 2-star events; no entry within 3h of relevant 3-star/red events (6h for NFP/FOMC)
Entry Level
The precise price where your pending order triggers:
- W Bottom (long): neckline + 0.5 pip + broker spread
- M Top (short): neckline − 0.5 pip (no spread added)
Expected Hold Window
Estimated time from pattern formation to PCL completion. Calculated as the time from the start of the run-up/run-down into leg 1 to the first touch of the neckline. Optionally scaled by ATR ratio.
Fair Value Gap (FVG)
See Inefficient Candle.
Impulsive Move
A strong directional move characterized by large, same-color candles with shallow pullbacks. Indicates momentum and is a prerequisite for valid M/W patterns.
Inefficient Candle
A price move that leaves an imbalance or gap in trading activity, often appearing as a candle with minimal overlap with adjacent candles. May act as a magnet for future price action. Also called Fair Value Gap (FVG).
Invalidation
When price action breaches hard rules that negate the M/W setup. Common triggers:
- Neckline fails decisively in the wrong direction
- Structural break that negates M/W geometry (e.g., higher high in M short)
- Adverse liquidity sweep removes the setup's edge
- Material news event flips conditions
Leg
One of the two comparable swings forming the M or W pattern (left leg and right leg). Also called "side."
Liquidity Pool
A price level where many stop losses or pending orders are clustered, often at round numbers or obvious swing points. Price may seek these levels before reversing.
Liquidity Sweep
When price briefly trades through a prior high (for M) or low (for W) to trigger stops/orders, then snaps back. A failed sweep near the neckline increases pattern probability.
M Top
A double-top-style reversal pattern where price forms two swing highs (peaks) before reversing lower. Used for short/sell trades.
Manual Close
Rule-based discretionary exit before SL/TP when conditions degrade:
- Structure turns against the setup
- Inefficiency forms against position
- High-impact news imminent
- Momentum stalls at adverse liquidity pools
Neckline
The horizontal reference level used to confirm and trigger the M/W pattern:
- M Top: horizontal line at the lowest body between the two highs (not the wick)
- W Bottom: horizontal line at the highest body between the two lows (not the wick)
1R (One R)
The risk unit for a trade, calculated as the absolute distance between your entry (neckline) and your true stop loss. Used to measure reward multiples (e.g., 2R = twice your risk).
Formula: 1R = |neckline − true SL|
Pattern Completion Level (PCL)
The target level where the M/W pattern is expected to complete, calculated by projecting 1R distance from the neckline in the trade direction:
- W Bottom: PCL = neckline + 1R (above neckline)
- M Top: PCL = neckline − 1R (below neckline)
Must validate by extending a horizontal line left—it should intersect bodies of the prior impulsive move.
Pending Order
An instruction to your broker to buy or sell at a specified future price. For M/W patterns:
- W Bottom: Buy Stop (triggers when price rises to entry level)
- M Top: Sell Stop (triggers when price falls to entry level)
Previous Price Action (PPA)
Analysis of recent structure before pattern formation to assess probability:
- Strength/weakness into the level (impulsive vs. corrective)
- Liquidity sweeps and follow-through
- Nearby highs/lows and session levels
- FVG/inefficiency confluence
- Clean retests vs. messy chop
Pullback Depth
The retracement between the two legs of the M/W pattern, measured from the extreme of the first leg to the lowest/highest body of the pullback:
- Preferred: ≤40% of the impulsive move
- Hard maximum: 50% of the impulsive move
R-Multiple
A measure of distance expressed in risk units (R). Example: if 1R = 20 pips, then a roadblock 15 pips away = 0.75R.
Retest
When price returns to test a previously broken level. Not required for M/W entry (patterns often go straight to target), but can provide lower-risk entry if it occurs.
Risk Management
The systematic control of position size and stop placement to limit account drawdown. For M/W patterns:
- Risk per trade: 0.5–2% of account (1% common default)
- Minimum SL size: ≥10× broker spread
- Never widen stops to "fit" a setup
Risk-to-Reward Ratio (R:R)
The ratio of potential profit to potential loss. For M/W patterns, realistic 1:1 targets are often optimal. Includes spread in calculations.
Roadblock
Any technical or contextual obstacle between entry and PCL that can hinder price reaching the target:
- Weekly trend lines
- Strong support/resistance levels
- Fresh opposing inefficiencies/FVGs
- Liquidity pools
- Major session levels
If a roadblock is <1R away, consider skipping, waiting for clearance, or targeting just before it.
Rogue Wick
An isolated, unusually long wick that appears anomalous compared to surrounding price action. May be ignored for neckline and SL placement in specific cases (max 1 per side), using candle bodies instead. Must recompute 1R and verify SL still ≥10× spread.
Session Levels
Key price levels associated with major trading sessions (Asian, London, New York opens/closes). Active sessions amplify moves; illiquid periods favor chop.
Square-Up Level
The price level where an inefficient candle (FVG) is expected to be "filled" or balanced by opposite price action. May serve as an extended target beyond PCL for partial profit management.
Stop Loss (SL)
The protective price level where the trade is automatically closed to limit loss:
- W Bottom (long): 1 pip below the selected swing low (may ignore one rogue wick)
- M Top (short): 1 pip above the selected swing high + broker spread
Never widen stops to accommodate roadblocks.
Support and Resistance (S/R)
Price levels where historical buying (support) or selling (resistance) pressure has been strong. Major S/R between entry and PCL acts as a roadblock.
Swing High/Low
A local peak (swing high) or trough (swing low) where price reversed direction. Used to identify M/W structure and define stop loss levels.
Take Profit (TP)
The target price level where you plan to close the trade for profit. Typically set a few pips inside the PCL for fill reliability. Optional partials near 1R while keeping overall R:R ≥1.
Timeframe
The duration each candlestick represents (e.g., H1 = 1 hour, H4 = 4 hours). M/W method trades primarily on H1 and H4; do not trade below H1.
Trend Line (TL)
A diagonal line connecting a series of swing highs (downtrend) or swing lows (uptrend). Weekly trend lines between entry and PCL invalidate the setup.
True Stop Loss
The stop loss price after accounting for spread and buffer:
- W Bottom: swing low − 1 pip (no spread adjustment)
- M Top: swing high + 1 pip + broker spread
Used to calculate 1R accurately.
W Bottom
A double-bottom-style reversal pattern where price forms two swing lows (troughs) before reversing higher. Used for long/buy trades.
Wick
The thin line extending above and below a candle's body, representing the high and low prices during that period. Generally respected for stop loss placement unless identified as a rogue wick.
Creating your schedule
- Establish times when you'll be studying / trading 1.1. Communicate them with your family
- Commit to the times
- Make a daily achievment chart
Why is this important
It creates discpiline, consistency and an understanding of the price action that is common at those times of the day.
Clarity of mind => profitability
How do you do it ?
Analyse your daily movements and commitments to see whan you'll be available on a daily basis. Commit to the times that you can. Tell your family and friends.
Commit
It's important to commit to this and build a habit out of it.
Barriers you'll face
- Life goets in the way - there are distractions
- You may find it dificult to work from home.
- Properly analyse your daily routine to identify barriers and make a plan to overcome them.
Overcoming these barriers
- Beingc disciplined and focused - mentally commit to the trading time periods
- tell you family an friends waht you are doing and whe nyou are doing it so they can know and support you.
Stay motivated
- Contrate on your end goal
- It may be tough at times, but if it's worth having it'll cost
How to remain consistent
- Establish aworking time periods of rstudy, practice, ananlysis and trading
- Create a chart to track your progress, and fill it in with ticks or stars for days that you achieve your working periods.
- Adhere to your established working time periods and track your progress consistently.
- Reward yourself for a full week of achievements to help sty motivated and on track with your trading goals.
Example rewards for consisteNcy
- take a break and to do something enjoyable,
- spend time with family or friends
- Read a book or watch a movie
- Treat yourself to a favorite snack or drink
- Engage in a hobby or activity you enjoy, such as playing a sport or working on a craft project.
- Make it known that the reward is for sticking to your schedule.
An unstructured traider looks like
Struggling to find consistent periods of the day ot trade. Randomly going into the course or charts whenever you get a few minutes. Getting very few tickts/stars on the daily achievement chart.
A somewhat structured trader looks like:
Mostly finding that you adhere to the time frames - but you are still getting distracte from time to time and losing focus.
Getting more ticks/starts on yuor chart than not, but not achieving a full week.
A fully structured tradier looks like:
Fully focused and commited to the time slots. Nothing gets int he waoy of your trading "job", relishing the time in front of the charts aor studying the courses.
Always bieng rewarded at the end of the week as you will have a full-house of daily ticks/stars.
Action items
- Download the checklist and project sheet
- Move onto the next lesson and complete the project.
Making a watch list
Why is it important
- Focused approach
- Over time you will develop a good understanding of how the price of each instrument moves
- Better risk management - easier to manage risk exposure
- Enable's you to identify potential trading opportunities in advance and flag them
- Set up technically analysed charts for each instrument
- Consistency
Without your watch-list:
- have a non-focused approach and random searching for opportunities.
- You may waste time and find it difficult to control risk (or see correlated instruments etc.)
- A trader doesn't build up a knowledge base of the price movement nuances of each instrument, the chart will not have been technically analysed before and marked up with key price levels etc.
Head and Shoulders
Appropriate time frame
Why is this important
- If you identify the pattern on too high a time frame, you can miss opportunities.
- If you identify the pattern on too low a time frame, you can get false signals.
Identify candle 1
- Find the anchor point (bottom of left shoulder, bottom of candle body (not wick)), extend left. 1st candle body you hit is candle 1.
- Find the end by extending the anchor point through the bottom of the right shoulder, to the outside of the shoulder candle body. This is the last bar.
Assess the time frame
On the 15 minute or 1 hour charts, the pattern length should be 30-120 candles (inclusive).
If there are too few, go down a time frame. If there are too many go up a time frame. Then re-asses.
On the 4 hour chart There should be 30-180 candles.
On the Daily chart - there should be between 30-210 candles.
Minimum 15 minutes. Maximum weekly.
Pattern completion level
We get the take profit from the pattern completion level (PCL).
- Measure vertical distance from top of head (including wicks or body; you can ignore rogue wicks.
- Continue it the same distance past the neckline. That is the PCL level
- On the horizontal line where the PCL level is, look left to find a candle body.
3.1. Has price been there before ?
3.2.
 3.3. In this example, if we use the wick in the head, the price has practically has never been to the PCL level before, so in this case, you'd consider not including the wick:
 3.4. In this example, price has never been to the PCL before, so the pattern is not valid:

Barriers to overcome
- You have to trust your own judgement.
- Use the rules and your checklist.
- Practice.
Road to success
- Just scroll back in time to find some
- See if you can find some in replay mode
- Demo
- Live 1 unit
- Live
Eta to mastery: 6-12 months
News
What we'll learn
- How to be aware of upcoming economic news releases and earnings reports
- How to use the news calendar or earnings report website
- How to understand which news releases affect which instruments, and how much potential move to expect
9 phrases to know
- Economic Indicators: Statistical data points that provide insights into the health and performance of an economy.
- Central Bank Decisions: Central banks can really move the market with their monetary policy and statements. This is a massive one to keep an eye on.
- Non-farm payrolls (NFP): Monthly employment report released by the US Bureau of Labour Statistics. Used to be the biggest event of the month, but has been superseded by interest rate decisions and inflation data (as of 2023).
- Interest Rate Decisions: Currently the most market-moving events. When rates have been moving regularly, markets go wild - particularly if the decision is different from expectations.
- Inflation Data: Inflation measures the rate at which prices for goods and services are rising. Currently a hot topic that can make even 2-star events move markets significantly.
- Gross Domestic Product (GDP): A key measure of economic activity representing the total value of goods and services produced within a country. A strong GDP often means a strong currency.
- Speeches by Government Officials: If an official gives a more hawkish (or dovish) response than previously, it can signal policy changes and cause big market reactions. You need to know when these are happening to avoid trading during them.
- Geopolitical Events: Wars, elections, trade disputes - all can have massive impact on currencies and indexes.
- Economic Calendar: Lists economic events and releases with dates and times. No excuse for not knowing what's coming up.
Use an economic calendar
- https://www.forexfactory.com/calendar/
- https://www.investing.com/economic-calendar-/
- https://www.fxstreet.com/economic-calendar
For earnings reports
- Trading View
- https://seekingalpha.com/earnings/earnings-calendar
- https://www.benzinga.com/earnings
- https://www.investing.com/earnings-calendar/
Holiday Blackout Period
Do not trade between December 15 and January 15.
During this period:
- Low liquidity due to institutional traders on vacation
- Erratic price movements
- Wider spreads
- Patterns are less reliable
If you choose to trade during this period, stick to low-spread instruments only.
When not to trade (news events)
Forex & Commodities
| Timeframe | News Stars | Hours to Block | Notes |
|---|---|---|---|
| 15 minute | 2 or 3 | 3 | Both 2-star and 3-star matter |
| 1 hour+ | 3 only | 8 | 2-star events get "soaked up" by the larger timeframe |
Stocks
| Timeframe | Event Type | Hours to Block |
|---|---|---|
| 1 hour | Earnings | 48 |
| 4 hour | Earnings | 48 |
Important caveats
-
USD 3-star events affect virtually everything - not just USD pairs. If there's a big US release coming, it will likely affect all currency pairs, commodities, and indexes.
-
Hot topics can elevate 2-star events - If inflation is currently a hot topic, even a 2-star inflation-related release can rock the markets. In six months, it might be something else. Use judgment and experience.
-
EUR events often affect GBP and CHF - They're reasonably well correlated.
Forex Factory color coding
- Yellow = 1-star (low impact) - ignore
- Orange = 2-star (medium impact)
- Red = 3-star (high impact)
Filter settings
- Filter for this week (not just today) - this lets you see overnight releases
- Filter out 1-star/yellow events
- Filter countries to only those relevant to your trading
Why avoid news?
Institutions love to use economic news to find liquidity for their trades:
- They know trade volume increases around news events
- They push price in one direction to take out stops
- They fill their big orders using that liquidity
- Then they move price strongly in the other direction
This creates whipsaw price action - price moving strongly one way, then reversing. You can be right about the eventual direction but still get stopped out. Spreads also widen around news events, making stop-outs more likely.
Key points
- Be aware of upcoming news releases and earnings reports
- Use a good economic news calendar (Forex Factory, Investing.com, FX Street)
- Understand which releases affect which instruments - USD affects almost everything
- Higher timeframes = look further ahead (trades take longer to play out)
- Experience counts - the more you observe price reactions to news, the better you'll get
- Use a checklist before entering trades - checking for news should be on it
- Don't let this paralyze your trading - these are guidelines, not absolute rules
TradingView tip
On TradingView, the chart itself shows when the next earnings date is for stocks - displayed as a point at the bottom of your chart. Very useful for avoiding earnings surprises.
News Decision Flowchart
Use this flowchart to determine what action to take regarding news events.
┌─────────────────────────────────────────────────────────────────────────────┐
│                         NEWS EVENT DECISION FLOWCHART                       │
└─────────────────────────────────────────────────────────────────────────────┘

START: What instrument class are you trading?
       │
       ├─► STOCKS ──────────────────────────────────────────────────┐
       │                                                            │
       │   Is there an EARNINGS REPORT within 48 hours?             │
       │       │                                                    │
       │       ├─► YES ─► Are you already in a trade?               │
       │       │             │                                      │
       │       │             ├─► YES ─► CLOSE THE TRADE             │
       │       │             │         (Don't risk earnings gap)    │
       │       │             │                                      │
       │       │             └─► NO ──► DO NOT ENTER                │
       │       │                        (Wait until after earnings) │
       │       │                                                    │
       │       └─► NO ──► PROCEED (news is not blocking)            │
       │                                                            │
       └─► FOREX / COMMODITIES / INDICES ───────────────────────────┘
                  │
                  ▼
       What TIMEFRAME are you trading?
       │
       ├─► 15 MINUTE ──────────────────────────────────────────────┐
       │                                                            │
       │   Is there a 2-star OR 3-star event within 3 HOURS?        │
       │   (Include USD 3-star even if not trading USD pairs)       │
       │       │                                                    │
       │       ├─► YES ─► Are you already in a trade?               │
       │       │             │                                      │
       │       │             ├─► YES ─► Is price close to SL?       │
       │       │             │             │                        │
       │       │             │             ├─► YES ─► CLOSE NOW     │
       │       │             │             │   (Spread widening     │
       │       │             │             │    will likely stop    │
       │       │             │             │    you out anyway)     │
       │       │             │             │                        │
       │       │             │             └─► NO ──► CLOSE BEFORE  │
       │       │             │                       EVENT          │
       │       │             │                                      │
       │       │             └─► NO ──► DO NOT ENTER                │
       │       │                        (Event is within 3h window) │
       │       │                                                    │
       │       └─► NO ──► PROCEED (news is not blocking)            │
       │                                                            │
       └─► 1 HOUR or 4 HOUR (H1/H4) ────────────────────────────────┘
                  │
                  ▼
       Is there a 3-STAR event within 8 HOURS?
       (Include USD 3-star even if not trading USD pairs)
       (EUR 3-star also affects GBP and CHF)
       │
       ├─► YES ─► Are you already in a trade?
       │             │
       │             ├─► YES ─► Is price close to SL?
       │             │             │
       │             │             ├─► YES ─► CLOSE NOW
       │             │             │         (Spread widening risk)
       │             │             │
       │             │             └─► NO ──► How close is the event?
       │             │                           │
       │             │                           ├─► IMMINENT (<1h) ─► CLOSE NOW
       │             │                           │
       │             │                           └─► NOT IMMINENT ──► Monitor;
       │             │                                               close before
       │             │                                               event if still
       │             │                                               in trade
       │             │
       │             └─► NO ──► DO NOT ENTER
       │                        (Event is within 8h window)
       │
       ├─► NO, but there's a 2-STAR event ─────────────────────────┐
       │                                                           │
       │   Is it a "HOT TOPIC" 2-star? (e.g., inflation-related    │
       │   during high-inflation periods)                          │
       │       │                                                   │
       │       ├─► YES ─► Treat as 3-star (see above)              │
       │       │                                                   │
       │       └─► NO ──► PROCEED                                  │
       │                  (H1+ timeframes absorb 2-star noise)     │
       │                                                           │
       └─► NO relevant news ─► PROCEED (news is not blocking)      │
                                                                   │
└──────────────────────────────────────────────────────────────────┘

ACTIONS SUMMARY:
┌────────────────┬────────────────────────────────────────────────────────────┐
│ Action         │ When to use                                                │
├────────────────┼────────────────────────────────────────────────────────────┤
│ PROCEED        │ No blocking news; safe to enter or hold trade              │
├────────────────┼────────────────────────────────────────────────────────────┤
│ DO NOT ENTER   │ Blocking news ahead; wait for window to clear              │
├────────────────┼────────────────────────────────────────────────────────────┤
│ CLOSE NOW      │ In trade + event imminent OR price near SL                 │
│                │ (spreads widen, slippage common - don't rely on SL)        │
├────────────────┼────────────────────────────────────────────────────────────┤
│ CLOSE BEFORE   │ In trade + event coming but not imminent                   │
│ EVENT          │ (exit in profit or loss before the release)                │
└────────────────┴────────────────────────────────────────────────────────────┘

QUICK REFERENCE TABLE:
┌─────────────┬───────────┬────────────┬─────────────────────────────────────┐
│ Instrument  │ Timeframe │ News Level │ Blackout Window                     │
├─────────────┼───────────┼────────────┼─────────────────────────────────────┤
│ Forex/Comms │ M15       │ 2 or 3★    │ 3 hours                             │
│ Forex/Comms │ H1+       │ 3★ only    │ 8 hours                             │
│ Forex/Comms │ H1+       │ 2★         │ Ignore (unless hot topic)           │
│ Stocks      │ H1/H4     │ Earnings   │ 48 hours                            │
│ ANY         │ ANY       │ USD 3★     │ Use above windows (affects ALL)     │
└─────────────┴───────────┴────────────┴─────────────────────────────────────┘
Road blocks
Here's what we'll learn
- Draw weekly trend lines
- Support and resistance
- How to make informed decisions by being aware of potential roadblocks
- Higher time frames - 3 or more reversal touches == strong
- Understanding that more powerful S&4 levels have price reversals both to the upside and downside
- The importance of becoming proficient at identifying S&R levels.
What is a road block
Anything that could block your trade between entry and take profit target.
Roadblocks include:
- Weekly trendlines between entry and PCL
- Strong S/R levels (3+ touches on higher timeframe)
- Opposite-direction inefficient candles very close to entry
NOT roadblocks:
- Inefficient candles in your trade direction - these are targets (price magnets)
- S/R levels with only 1-2 touches (weak)
- Levels beyond your PCL
Why learn this ?
- Helps us to create an exit strategy.
- Adjusting take profit levels
- Analyzing market structure
- Make more informed trading decisions
- Increase your chance of success
What will happen if you don't learn this.
- You enter trades that you shouldn't have entered
- Mysterious price reversals taking you by surprise.
Once you learn this, you will:
- Make informed decisions about each trade
- Keep more of your profits
- Be more confident and proactively anticipate market movement.
Glossary
- Trendlines: A graphical representation created by connecting pivot highs or pivot lows to illustrate teh mdominant price direction.
- Economic news events: Release of market-moving reports such as CPI, jobless claims, etc.
- Support & Resistance: Support is a price level in trading where buying pressure is expected to prevent further decline, acting as a floor for the asset's price.
Steps for mastering road blocks
Step 1: Trendlines
A diagonal line where price "bounces" from at least 2 times.
- Open the chart on your chosen instrument
- Go to the weekly time frame, and scrunch it up as far back as it'll go, eg to 1983 :o
- Establish the high and the low of entire price action
- Select the trendline tool; make sure "extend right" is enabled.
- Draw the trend lines from the highest pivot high, to a subsequent pivot highs.
- Same for lows.
- Repeat for the second most significant high/low, and so on until all highs and lows that can be connected, without going through candles are connected.
Step 2: Support and Resistance - Part 1
A horizontal line where price "bounces" from at least 2 times.
- When doing a trade, mark the entry and the pattern completion level with horizontal lines extended left
- Go on time frame up
- Check for horizontal lines between those two where price has bounced off of it 3 times or more. 3.1. If the line has been both support and resistance, it is stronger.
- Mark the support and resistance lines with a horizontal line.
Previous Price Action
- Previous Price Action
- What we'll learn
- Why should you learn this
- If you don't learn it
- Imagine what it will be like when can do this
- 4 Phrases you need to know
- 4 Steps to mastering PPA
- 1. Identify the previous price action
- 2. Assess the price action
- 3. Historical levels of support and resistance
- 4. Inefficient candles
- Being able to assess the Price Action that leads into the H&S pattern will:
- Challenges to mastery
- How can you identify and overcome these barriers?
- When you're mastering this, stay motivated!
- Over time, how can you build consistency ?
- Stages of progress on the way to mastery
What we'll learn
- How to increase the likelihood of Reversal patterns going ot full profit target.
- How to make sure the PPA is long enough to allow the pattern to complete
- Recognize the importance of strong and clean price action leading into the pattern.
- Avoid trading in choppy price action and focus on clear trends.
- Identify historical support and resistance levels between the neckline and target level.
- Discover the potential of inefficient candles below the neckline that can help price reach the target quickly.
- Trade only high quality setups.
- Develop patience and discipline by leaving the uncertain trades and waiting for the next setup.
Why should you learn this
Previous price action is vital when trading a Head and Shoulders pattern.
Why?
- Pattern Validation: it will help you validate the existence of the Head & Shoulders pattern.
- Measuring Target: It will help you estimate the potential price target for the pattern and give you a clue to how quickly & smoothly price will reach this target.
- Support and Resistance Levels: It reveals key support and resistance levels that may influence the Head & Shoulders patterns' outcome. For this, you will be examining how the price reacted to these levels in the past, as they can impact the pattern's reliability and potential reversal areas.
If you don't learn it
You will not be as profitable at trading the H&S patterns if you don't learn how to assess Previous Price Action
How come ?
- You won't be able to identify the most appropriate Take Profit Level.
- You will have little clue as to how price action is likely to behave when it breaks the neckline.
Imagine what it will be like when can do this
Maximize the potential of any H%S or inverted H&S pattern.
Mastering Previous Price Action will allow you to be able to do this.
How?
- By being able to fully identify the most appropriate Take Profit level.
- And having a great insight into how price action is likely to behave when it breaks the neckline.
4 Phrases you need to know
- Clean Price Action: the movement of price on a chart without teh presence of excessive noise, distractions, or false signals.
- This typically indicates a clear and unambiguous trend direction and can be observed in both uptrends and downtrends.
- Choppy Price Action: A market condition where the price movement is characterized by frequent and erratic fluctuations without displaying a clear and sustained trend.
- Squared up: When future price action has retraced at least 50% into the range of a previous candle.
- The vast majority of candles are squared-up.
- candles that aren't squared up are called inefficient candles.
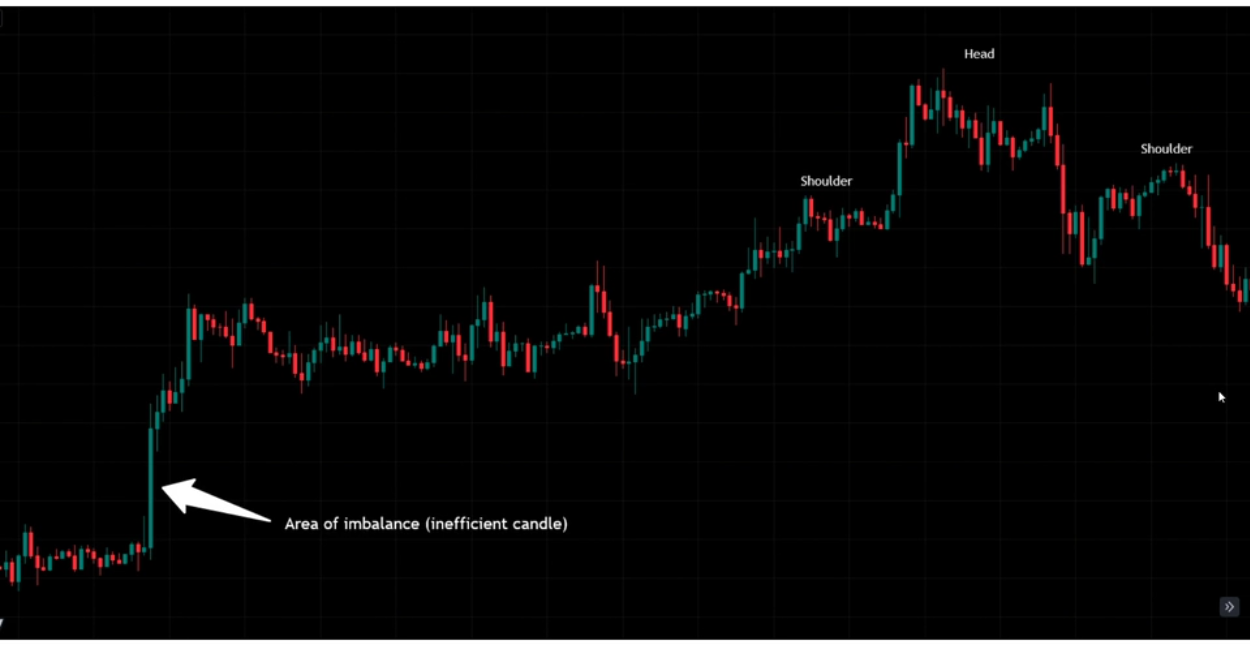
- Inefficient Candle: A candlestick that displays a large body and a disproportionate range between its high and low prices.
- Immediate future price action does not retrace back halfway up (or down) the candle, thereby leaving an imbalanced market. 99.999% of candles are squared up (eventually) by price retracing at least 50% into the range of the candle.
- When this does not happen, it leaves behind a imbalance in the market and the candle is called an inefficient candle.
- Inefficient candles often act as a magnet for price and may indicate potential trading opportunities.
4 Steps to mastering PPA
1. Identify the previous price action
We first start by identifying the price action leading into the left shoulder of the H%S pattern.
- The precise area of the chart must be identified in order to make a proper assessment of the relevant price action.
How do you do this?
- Establish the area af price immediately preceding the left shoulder that is between the PCL and the start of the left shoulder.
This will be a move up in price for a H&S pattern, or a move down in price for an inverted H&S pattern.
2. Assess the price action
This is key ot establishing whether the desirable price action is in evidence.
How do you do this ?
- Visually asses the price action between the PCL and the left shoulder to see if it is clean (desirable), choppy (undesirable) or in-between (not ideal, but still tradeable with caution).
3. Historical levels of support and resistance
Now we will identify areas of price action that may have historical levels of support and resistance.
- it is necessary to be able to identify potential level of support and resistance, between the neckline and PCL that may provide a block to price preaching eth take profit target.
How do you do this?
- Look for areas of price action that break up the clean price trend.
- These can be sideway consolidation areas or pull-backs.
- Look back to see if these areas represent historical levels of S&R
4. Inefficient candles
These are areas of imbalance and are therefore important as they can help price move in the desired direction.
How do you do this ?
Look for a large, big-bodied candle that has not been squared up.
- Squared up refers to a candle where future price action has come back to at least half way back up, or down the candle.
The bigger the candle, the more pulling power it may have.
If you notice an area of S&R blocking your way to take profit, and it's more than half way down, and you still get a good risk to reward ratio (like >= 1.5) then just set the take profit at the top of that area of S&R.
Being able to assess the Price Action that leads into the H&S pattern will:
- Significantly increase your win rate when trading H&S Patters
- Increase your consistency
Challenges to mastery
- You may struggle to be able to asses the price action as being good, bad, or indifferent.
- Not seeing the areas of potential support and resistance.
- Not understanding what an inefficient candle is.
- Lack of belief in the power of Previous Price Action
How can you identify and overcome these barriers?
(You can identify these barriers by seeing trades repeatedly reverse an themselves before going to target.
And you can overcome the by practicing with bar replay.
- When a H&S form, asseS the PPA and make judgement whether you would trade the pattern or not, then observe the result
When you're mastering this, stay motivated!
A few things to remember are..
- That you are not on your own, and everyone will struggle at the start.
- There will be a steep learning curve.
- It is a process and like anything, it will take time to master, so be patient and don't expect too much too soon.
Over time, how can you build consistency ?
Practice with your best friend: bar replay.
When a H&S pattern forms:
- Asses the PPA
- Decide whether you would trade the pattern or not.
- Observe the result.
Stages of progress on the way to mastery
Beginner
- Trades H&S patterns without really paying much attention to the price action.
- looks at PPA, but struggles with interpreting it
- Forgets to look for areas of imbalance and will not always be able to recognise an inefficient candle.
- Struggles to recognise and often forgets to look for potential areas of support and resistance.
Everyone starts off as a beginner.
Intermediate
- Can understand PPA often
- Can usually see inefficient candles
- Mostly remember to investigate S&R levels
Then, you're starting to get this PPA concept figured out.
Remember, keep going! This is a vital step to mastering trading with the H&S pattern and there's still more improvement to be made.
Master
- Always look at PPA and understand it
- Enjoy and understand finding areas of imbalance.
- Quickly recognise all relevant inefficient candles.
- You have a comprehensive understanding of what specific price action warrants, further support & resistance investigation.
Congratulations!
You can use PPA with confidence in your strategy toolbox.
Break close and retest
You will learn
- Identify the specific price action that confirms and validates the pattern and sets up the trade.
- Distinguish between false and genuine reversals in price, thereby increasing the probability of having a successful trade.
- Wait for the ideal pre-trade price action.
- You will understand what a Break, Close and Retest (BCR) of the neckline is.
- Why it increases the probability of success
Why should you learn this
A BCR adds confirmation that the reversal is genuine.
More favourable trade entry levels, which improves the risk to reward of the trade, which is a good thing for you as a trader.
Retests are often followed by participants entering the market adding strength and volatility to the move.
It also encourages you to be disciplined about your trading, making it so you are not just jumping in when you see price break a level, which would often lead to many more false signals.o
If you don't learn it, this will happen
You will be plagued by bad trades generated by false reversal signals, leading you to be stopped out more often, losing money from a trade, instead of making a profit.
Your risk to reward will suffer, resulting in lower profitability.
Your discipline as a trader ill be lower, leading you to take random price entries and FOMO trades, which will lead to inconsistency.
What it'll be like, once you've mastered this
You'll be a master at recognising price action behaviour that puts the odds very much in your favour.
You'll be confident and have a greater sense of control over your trading outcomes.
You'll be more capable of identifying opportunities, managing risks, and executing trades effectively.
This empowerment will lead to a stronger belief in your ability to achieve consistent profitability in the markets and result in having a deep sense of satisfaction and fulfilment.
Words to know
- Break: When the price moves beyond the neckline. This suggests a potential shift in market sentiment and indicates that the balance between buyers and sellers has shifted.
- Close: When a candle's closing price is beyond the neckline. After a price breaks through the neckline, it is important to asses whether the breakout is sustained or not. We look for a candlestick or bar to close above or below the breakout level to confirm the validity of the breakout. A close beyond the neckline suggests that there is sufficient momentum and conviction in the market, reinforcing the potential for a sustained price move.
- Retest: When price retraces back to the neckline (as a minimum) after a close beyond the neckline. Following the close beyond the neckline, we lOk for a price to retrace back to touch "(retest)" the neckline as a minimum. It is perfectly OK for price to retrace back all the way through the neckline as long as it does not invalidate the pattern. The retest is the last element of the BC&R price action. Once completed we can look for potential trade entries.
Practising
-
Correctly draw the neckline, and wait for the right shoulder to form
-
Close beyond: Make sure that the price candle or bar has closed beyond the neckline. This validates the neckline break and confirms the likelihood of a trend reversal.
If it passes beyond the neckline, then closes back on the original side, this is a false breakout.
For stocks, (not currency pairs) false breakouts ok, because stocks move faster.o
-
Retest: Make sure that price has retraced back to the neckline.
Price needs to touch the neckline (closing doesn't matter).
It's preferable that it passes back through the neckline, because it can give us a better risk to reward ratio.
Note: If price pushes to PCL before the retest, then the pattern is no invalidated.
Entry signal price pattern
You'll learn
- How to wait for the full break, close an retest before looking for entry setup pattern candles.
- How to identify and analyse three entry setup candle patterns:
- Pin-bar or Pin-candle
- Engulfing Candle
- Tweezers
- How to develop discipline and patience and wait for one of the three setup candle patterns to appear before considering entering a trade.
- How to overcome challenges such as learning to trust the system and controlling the impulse to enter trades early.
- How to manage frustrations when a trade doesn't work out despite following the rules, and staying calm when a trade reaches its target without presenting a valid entry.
Why should you learn this ?
Entry is the 2nd most important element of a trade (exit is the most important).
The financial markets can be volatile and unpredictable. By having well-defined entry signals, you can rely on objective criteria rather than emotions or hunches when initiating trades.
Other areas of benefit include:
- Better risk management
- Increased probability of success
- Consistency and Reproducible trades
- Avoiding over-trading
What happens if you don't learn this
Without suing clear entry signals, you are more likely to make impulsive decisions based on emotions such as fear, greed and or anxiety. Emotional trading can lead to erratic and inconsistent trading patterns, resulting in poor overall performance.
Also:
- Increased risk
- Lack of discipline leading to inconsistency of results
- Missed opportunities or over-trading
What it will be like, once you master this
You'll be a master of trade entry decision making.
You'll read and understand clearly the entry signals, and therefore make informed and objective decisions.
You will be able to identify high-probability trade entry levels with greater accuracy, based on well-defined criteria and reliable market indicators.
This will lead to better entry timing and enhances the overall quality of trades.
Glossary
- Pinbar (Pincandle): Characterised by a small body and a long protruding tail or shadow.
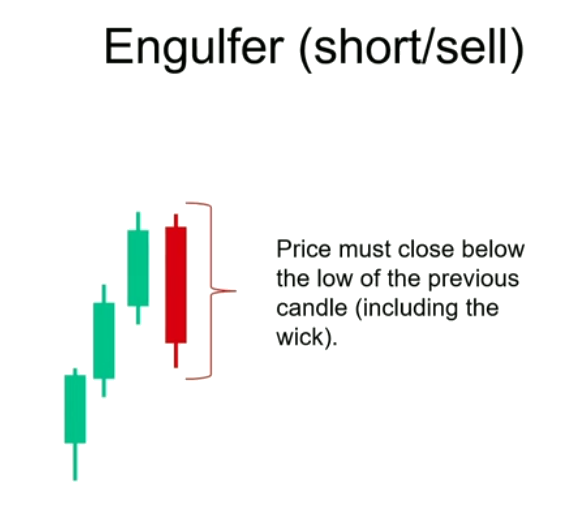
- Engulfer (Engulfing Candle): Consists of two consecutive candles. The second candle is larger and completely engulfs the entire body and one wick for of the first candle, hence the name, "engulfing" candle.
- In Forex it's impossible for a candle to completely engulf the entire previous candle, but it is possible in stocks
- Our engulfer only has to engulf one of the two wicks; the one in direction of travel (top for bullish, bottom for bearish).
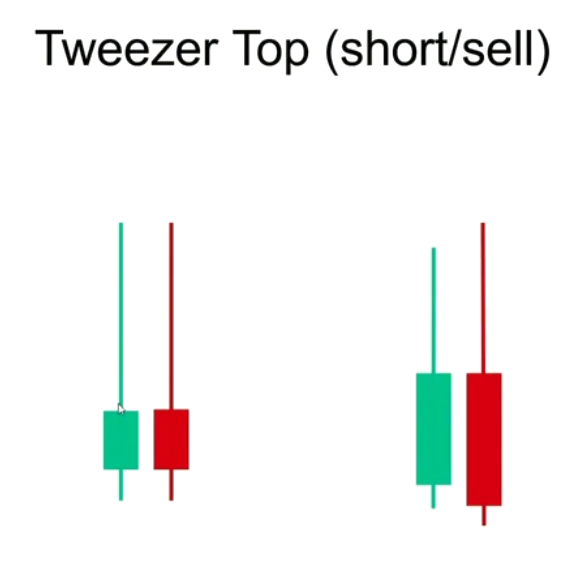
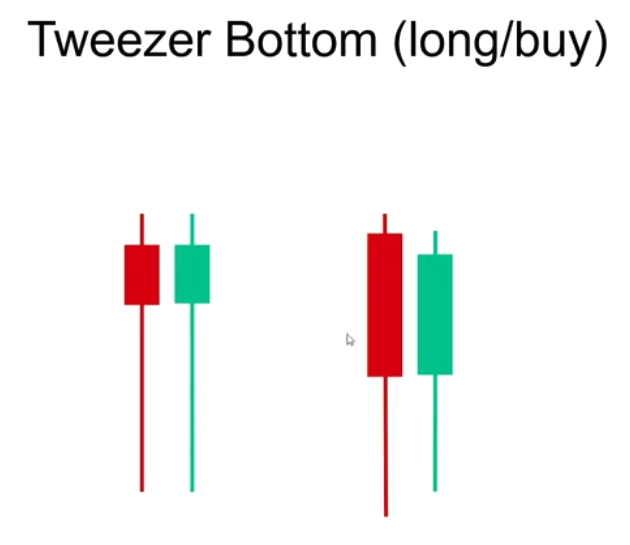
- Tweezer Candles: Two consecutive long wicked candles together.
Important!
Don't look for the entry until after the break, close, retest!
Patterns
Pinbar
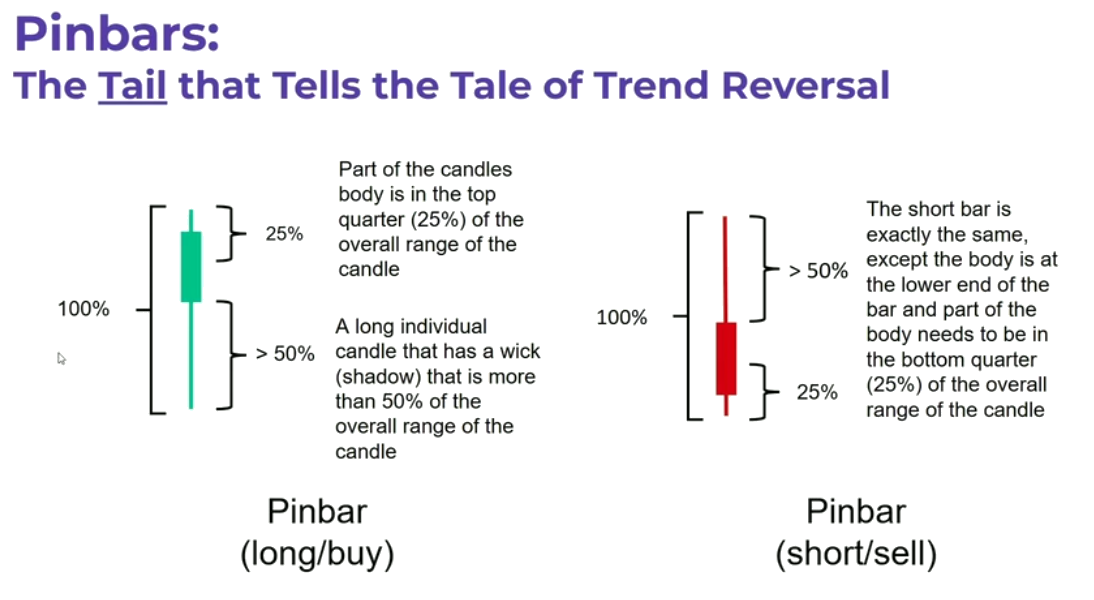
- Small body: < 50% of the candle. The body represents a narrow price range between the opening and closing prices.
- Bullish: Part of its body must be in the top 25% of the overall length of the candle.
- Bearish: Part of its body must be in the bottom 25% of the overall length of the candle.
- Long tail or wick: Long tail/wick - for long/buy signals, the bottom 50%+ of the candle should be wick. For short/sell candles, the top >= 50% of the candle should be wick. The tail represents the price range between the high or low and the closing or opening price, respectively.
- Small or Non existent, opposite wick: If the top wick is big; the lower wick should be small to non-existent, and vice-versa. This indicates that the price did not move significantly beyond the opening or closing level.
If a pinbar is a pivot point, it's extra strong. eg. for a bearish pinbar, its high should be higher than its neighbour's on both sides.
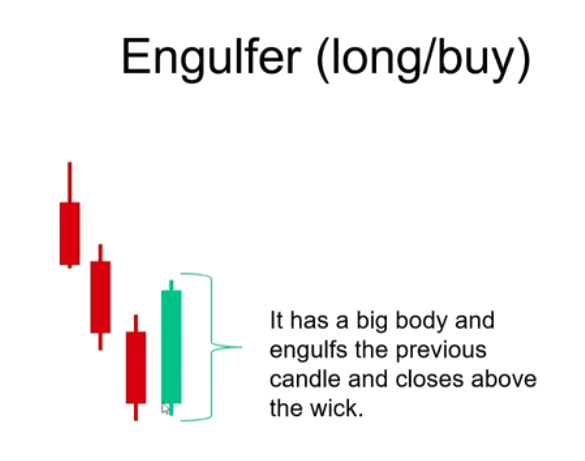
Engulfers
An engulfing candle completely engulfs the preceding candle's body and wick in the direction of travel so that it closes above (for bullish), or below (for bearish) the whole of the preceding candle.
- A bullish engulfer
- Open <= previous close
- close > previous high
- The close must be >= 75% of the entire candle height
- Follows a red candle
- Is a green candle
- A bearish engulfer
- open >= previous close
- close < previous low
- The close must be <= 25% of the entire candle height
- Follows a green candle
- Is a red candle
Floating engulfer
Same as a normal engulfer, but follows a candle of the same colour
Tweezer Candles
When 2 pin candles appear next to each other it looks like a pair of tweezers.
Unlike normal tweezer candles, where the wick must be >= 50% of the candle, they only have to be >= 35%.
They should have similar highs and lows.
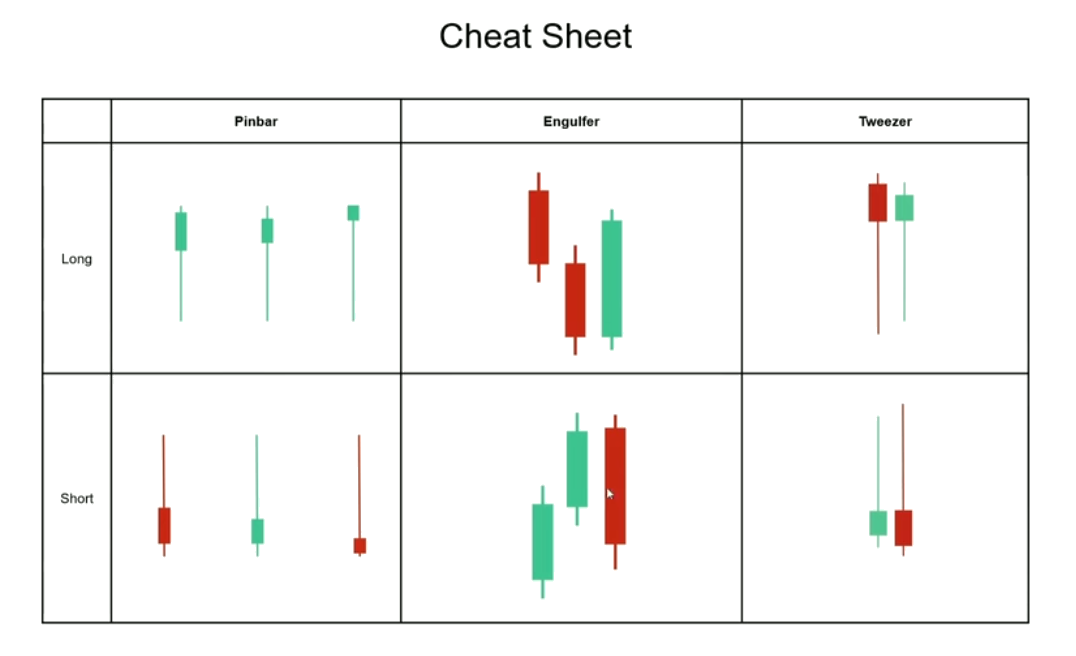
Cheat sheet
Invalidating candles
- For a bullish reversal signal, if price closes below it, it is invalidated.
- For a bearish reversal signal, if price closes above it, it is invalidated.
Challenges
- You may struggle with patience and timing, having to resist the temptation to enter trades prematurely or chase the market.
- You may come across false signals, where not every candle pattern will result in a successful trade.
- You may struggle with interpreting candle patterns.
- You may experience the impact fo market volatility, which can reduce the reliability and effectiveness of entry candle patterns due to erratic price movements and increased noise.
- You may encounter missed opportunities by waiting for a specific entry candle pattern.
- You may get FOMO or doubt in your analysis.
Signs if you do it wrong
- You enter trades before valid entry setup candles appear.
- You will be unsure of what a valid entry setup looks like and not know if y ou have entered a trade correctly.
- You will be frustrated and doubt the system, when a trade does not go to target, despite following the rules for entry.
- You will be impatient and frustrated waiting for the full setup to appear
- You will be doubly frustrated when the pattern completes and goes to PCL without giving a valid entry candle pattern.
How to overcome the challenges
- Focus on following the rules diligently
- Practice, and continuously backtest to improve your pattern recognition skills.
- Back-testing is particularly useful when comparing waiting for a high probability entry signal and entering arbitrarily.
- keep a trade journal to track the effectiveness of different entry candle patterns. This provides valuable insights for future trades. For example pin candles may work better in some markets than others. Generally tweezers work everywhere. But you'll see this for yourself when you go through your journal.
As you practice, remember:
- Motivation can fluctuate, and it's normal to expedience periods of lower motivation.
- Practice the strategies you're learning and remain positive.
- Have a long-term vision. Remember the potential rewards and benefits of trading.
- Break goals down into achievable steps, focusing on smaller tasks for a sense of progress and motivation.
- Seek support from fellow traders for encouragement and fresh perspectives. (Use the community and legacy student hangout room).
- Celebrate milestones: and progress along the way, regardless of their size - we want to see your posts
- Prioritise continuous learning and improvement with a growth mindset.
- Reflect on past successes to boost confidence and remind yourself of your capabilities
- Focus on the trading process, not just the results, to stay motivated and develop skills.
- Take breaks and practice self-care for mental emotional well-being.
How can you build consistency with this
Practice!
- Study and analyse historical price charts regularly. This is where backtesting can come in to push you forward! You many to to do this and it may sound dull...but it will be your secret to success.
- Practice identifying and marking entry signals on live charts. This is a step for every trade that you will take, so practising without taking a trade will set you up well.
- Maintain discipline by following your trading plan. Like I said, follow the rules and they will guide you to where you want to be.
Other things to take into account.
All of these are worded as if for a head and shoulders (short) entry, but just reverse the logic for long (inverted head and shoulders) entries.
- Check the trend. Going into the head, you should see higher highs higher lows. If you see lower highs and lower lows coming out of the head, before the entry; this is a good sign. If price is moving mostly sideways after the head, into the setup, this weakens the trade.
- Check for anti-entry patterns. If you want to go long, and you see a bearish pin-bar before your long entry pin-bar; that bearish candle weakens the trade setup.
- If you get a higher shoulder after the right shoulder, you have to re-draw the neck line and start again.
- if you get a high, higher than the head, the whole pattern is invalidated.
- If you get a bearish candle, and then price goes above it (I'm not sure if it has to close above it), that bearish candle is invalidated (same for bullish), and you have to look for a new entry signal. I'm just deriving this from logic; it might not be true
- If you get multiple setups (bearish candles) in small space; this make the trade idea stronger.
- Check for PPA inefficient candles, which may be a price magnet, strengthening the trade.
Stop loss and Take profit
You'll learn
- How to understand that stop loss and take profit rules are part of an effective risk management strategy.
- How to assess if you prefer aggressive or conservative stop losses based on your risk tolerance.
- How to plan stop loss and take profit levels in advance of entering a trade.
- How to consider potential roadblocks when setting the take profit level.
- How to trust the process and remain patient in following stop loss and take profit rules
Once you learn this, you will
- Effectively control your risk
- Protect your capital
- reduce emotional biases
- Maximise the profits of your trades
- Maintain consistency in your trading results
- Have a worry-free trading plan.
Step 1: Where do we get in ?
- Long trade (inverted head and shoulders): Just above the high of the entry candle.
- Short trade (standard head and shoulders): Just below the low of the entry candle.
Draw a line here and call it "entry"
Step 2: Determine the spread
Note to self: Also check market depth for stuff like lite-coin.
The spread is the distance between the bid and ask prices of the instrument..
Step 3: take profit
take profit distance from entry = PCL - entry - spread - 1 pip
- If you spread is 3 pips, place the TP 4 pips short of the PCL.
- If spread is 1.5 pips, put TP 2.5 pips short of PCL.
- If there's a strong S&R level very close, and just short of your TP, move you TP short of that line. Make sure risk to reward is still > 1:1
Step 4: stop loss
- Conservative: Above the head
- More aggressive: above the right shoulder
- Super aggressive: above the setup candle
Risk to Reward must always be better than 1:1.
Step 5: Risky business
You must have a positive risk to reward. (Better than 1:1).
This may mean that the conservative stop loss is not available. You need to decide to either skip the trade, or choose a more aggressive stop loss.
Measuring ratio
risk = entry - sl
reward = tp - entry
ratio = reward / risk
ratio must be >= 1
The more aggressive patterns are more profitable, but more psychologically challenging.
Holistic Picture
SL and TP is the final step before triggering the trade.
Planning your exit is essential to ensure you consistently trade with sensible levels of risk and take profit levels to ensure you have long term sustainability as a profitable trader.
Some challenges you may face
- Price hits SL, then goes to profit - can be very annoying
- Don't make emotional attachments to your trades. Be logical.
- You may have a learning curve in setting your TP based on PPA and S&R and attraction lines.
- Setting realistic TP targets can be another struggle. Don't worry about missing out, as long as you're making better than 1:1 risk to reward
- Don't be overconfident, impatient, nor second-guess your decisions.
- You are allowed to change between the three SL styles (conservative to super aggressive).
Guaranteed Stop Loss (GSL)
A Guaranteed Stop Loss is a broker feature that ensures your stop loss is executed at exactly your specified price, regardless of gaps or slippage. It typically costs a small premium (e.g., 3 pips).
What GSL Protects Against
GSL protects against gaps - situations where price jumps over your stop level:
- Weekend gaps - Market closes Friday, opens Monday at a different price
- Daily close gaps - Some instruments have daily trading breaks
- Flash crashes - Rare events where price skips multiple levels instantly
What GSL Does NOT Protect Against
GSL does not protect against normal price movement:
- News volatility where price moves through your stop (no gap, just fast movement)
- Whipsaws that hit your stop then reverse
- Any situation where price actually touches your stop level
During a news event like an interest rate decision, price typically moves aggressively rather than gaps. Your stop will get hit at roughly your level anyway - you'd be paying the premium for nothing.
When to Use GSL
| Scenario | Gap Risk? | Use GSL? |
|---|---|---|
| Holding over weekend | Yes | Yes |
| Holding through daily market close | Yes (some instruments) | Yes |
| Flash crash protection | Yes | Yes |
| Trading through scheduled news | No (moves, doesn't gap) | No |
| Intraday trades on liquid pairs | No | No |
When NOT to Use GSL
- Trading through news events - Follow blackout rules instead, or accept the movement risk. Price moves, it doesn't gap.
- Intraday trades - If you're in and out within the session, gap risk is minimal.
- Wide stops on liquid pairs - If your stop is 100 pips and typical slippage is 2-3 pips, that's only 2-3% extra. Not worth the premium.
Cost-Benefit Rule of Thumb
Use GSL when:
- The premium is less than 10% of your risk, AND
- You are exposed to genuine gap risk (weekend hold, market close, etc.)
Adjusting Take Profit for GSL Premium
If you pay a GSL premium, your effective risk increases. To maintain your intended risk:reward ratio, adjust your take profit accordingly.
Example:
- Original risk: 30 pips
- GSL premium: 3 pips
- Total effective risk: 33 pips
For 1:1 R:R with GSL, set your take profit at 33 pips (not 30).
Summary
GSL is insurance against gaps, not against movement. Use it for weekend holds and market close situations, not for trading through news events.
Entering the trade
You'll learn
- Pending and market orders and how to use them
- Accurately measure the stop loss distance.
- Input relevant details into a position size calculator
- Input into trade order window
- The importance of completing as much preparation in advance as possible for quicker and more accurate order execution.
- Value of verifying measurements and inputs before executing trades.
- Managing and easing pressure and stress through time, practice, and experience
Refresher
- Enter at or below the low of the setup candle for short. At or above the high of the setup candle for long.
- You will already have your potential entry price and stop loss level identified
- You already checked you will get a positive risk to reward ratio
Step 1: Position size calculation
Establish what trade volume (lot size) you will use for this trade.
-
Choose the level of risk you are willing to take on each trade to protect your capital.
- Maximum 1%
- Recommended 0.25% when starting out
-
Step 2: Position size calculation
Use a calculator :p
When to manually close the trade
5 instances when you should manually close the trade
- How long to let a trade run.
- Which trades to close before the weekend
- When to close your trade before a major news event
- When you should close the trade at end of the trading day
- Certain levels of support and resistance
Why should you learn this
- Clear trade exit rules:
- build consistency
- More profitable
- Predictable results
- These have been honed to maximise trading results.
- More relaxed; you know exactly what to do in each situation
If you don't learn it
- Inconsistent trading results
- Emotional regret
- Confusion of what to do
- Less success
Overview
- Most trades should be left to run to TP or SL
- There are certain situations where we need to intervene
Once you learn this
- You'll be able to relax during a trade; knowing how to react in any circumstance
- You'll be better prepared than 99.9% of retail traders when you enter into a trade..
- You'll achieve your goal of being a consistently profitable trader, because of following the tried, tested, and proven rules
Scenario 1: Going sideways too slowly
- Count the number of candles from left to right of the head and shoulders (the bodies that the neckline hits) (that number is 'x')
- To find the left candle: 1. Find the left neckline 2. Draw a horizontal line left 3. Pass the shoulder high/low candle 4. First body you hit, is candle 1
- To find the right candle: 1. This is the first candle that breaks the neckline after the right shoulder high/low.
- Count forward from the end of the right shoulder. Once we reach
xcandles, and it hasn't hit TP nor SL, close the trade
To find the left of the left shoulder. Draw a horizontal line until you hit a candle body from the beginning of the neck line. The right of the right shoulder, is the first candle to close past the neckline.
Scenario 2: Closing a trade before a major economic event
- Keep a close eye on your economic calendar
- If a 3 star / red event is imminent and it likely to have a significant influence on your trade, then close the trade before the event happens, regardless fo whether in profit or loss. Don't wait until it starts, or you may get major movement + slippage.
Scenario 3: Spread hour
At 10pm UK time, which is usually 5pm EST, the broker spreads of financial instruments dramatically widen.
- For example, instruments that enjoy a 1, 2, 3 pip spread through the London and New York sessions may have their spread widen to 20, 30, or even 40 pips during the 1st hour of the Asian session (10pm - 11pm OK time).
- After 11pm spreads reduce back to more reasonable levels, although not as low as during the London + New York sessions.
- If left open a trade that is 20 pips away from stop loss may easily be stopped out due to this spread widening.o
If left open, a trade that is 20 pips away from its stop-loss may easily be stopped out due to this spread widening.
Brisbane time zone of spread hour
| Month | New York Close (AEST) | Sydney Open (AEST) | Tokyo Open (AEST) | Spread Hour (AEST) | Notes |
|---|---|---|---|---|---|
| January | 7:00 AM | 7:00 AM | 9:00 AM | 7:00 AM – 9:00 AM | Sydney in DST (UTC+11), NY in DST |
| February | 7:00 AM | 7:00 AM | 9:00 AM | 7:00 AM – 9:00 AM | Sydney in DST |
| March | 8:00 AM | 7:00 AM | 9:00 AM | 7:00 AM – 9:00 AM | NY exits DST mid-March |
| April | 9:00 AM | 8:00 AM | 9:00 AM | 8:00 AM – 9:00 AM | Sydney exits DST early April |
| May | 9:00 AM | 8:00 AM | 9:00 AM | 8:00 AM – 9:00 AM | Stable session timing |
| June | 9:00 AM | 8:00 AM | 9:00 AM | 8:00 AM – 9:00 AM | Stable session timing |
| July | 9:00 AM | 8:00 AM | 9:00 AM | 8:00 AM – 9:00 AM | Stable session timing |
| August | 9:00 AM | 8:00 AM | 9:00 AM | 8:00 AM – 9:00 AM | Stable session timing |
| September | 9:00 AM | 8:00 AM | 9:00 AM | 8:00 AM – 9:00 AM | DST starts in Sydney early October |
| October | 8:00 AM | 7:00 AM | 9:00 AM | 7:00 AM – 9:00 AM | Sydney in DST |
| November | 8:00 AM | 7:00 AM | 9:00 AM | 7:00 AM – 9:00 AM | NY exits DST early November |
| December | 7:00 AM | 7:00 AM | 9:00 AM | 7:00 AM – 9:00 AM | NY in DST, Sydney in DST |
To plan for this
- 15-60 minutes before spread hour check for trades that are <50 pips from stop-loss.
- For these trades, either:
- Close the trade
- Temporarily move the stop-loss 50 pips further away; put it back after spreads have settled down
Scenario 4: The weekend
Some instruments will gap up or down on the weekend, and may jump over your stop-loss.
With Oanda, you can use a guaranteed stop loss as long.
If the geopolitical state of the world is exacerbated.
To avoid this
- Always close any shorter (15m to 1h) time frame, open trades before the market closes on Friday
- 4 hour and above is ok to leave open.
Scenario 5: Resistance lines
We've identified a level of support or resistance, but decided it's weak enough to trade anyway.
- Watch the trade more closely than you normally do, because you need to make a judgement call. Set an alarm at a predetermined level.
- Move your stop loss to break-even and observe what happens in the next 1-3 candles.
- If there was a strong rejection in the 1st candle, close the trade
- If price bounces weakly off of that level, keep observing the candles until you get clear direction of where the trade is going to go.
- Once price closes past the level, put your stop-loss back to normal and go and relax.
Note: The longer price goes sideways at a level, the more likely it is to push through it.
Review
- Most of the time, you'll let trades run to take-profito
- Only close the trade manually, while following the rules of one of the above scenarios
- Don't break these rules!
- You may have fear of loosing profit and want to close early - don't listen to it. Follow the rules
- You may have fear of getting stopped out - don't listen to it. Follow the rules
- You may have impatience due to sideways movement - Just follow the rules
How to build consistency
- We need to journal, what actually happened. What would have happened if made a different decision.
- Write down the reason (the scenario) if you close the trade manually.
- Keep your manual close checklist
Zones
- On the daily chart
- Search for a run-up, pull back, push-through, pull-back to top (retrace)
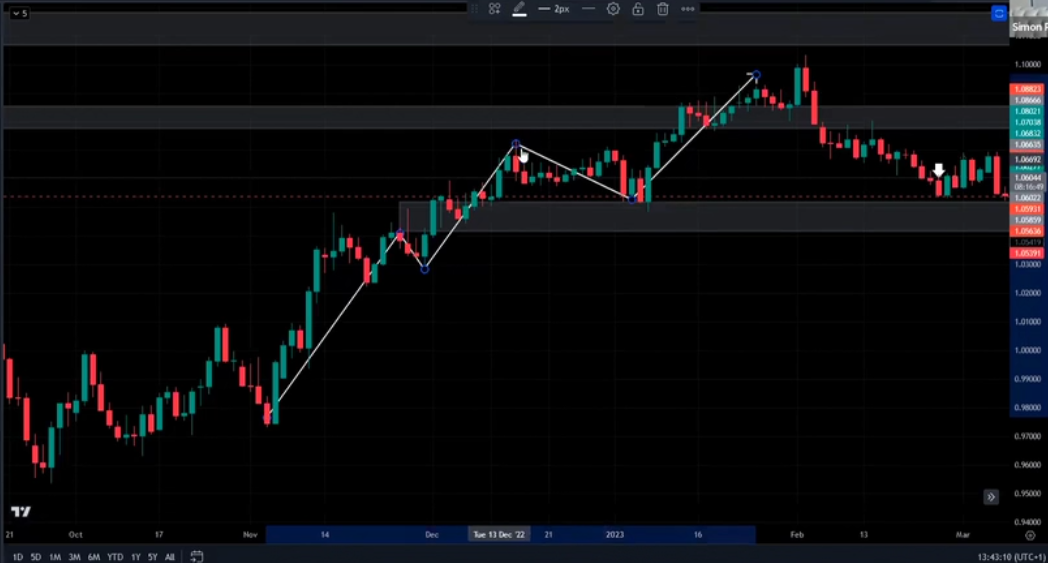
- Draw a rectangle from the top of the body of the first pull-back, to the bottom of the body of the retrace.
- Extend the rectangle to the right
- There must be some clean space in the pull-back under the zone, and above the zone before the retrace down
- After the retrace, price must go higher still
Letting the trade run
You will learn
- Double check the position of your Take Profit and Stop Loss levels
- Trust the position of these levels
- Let price do its thing until it hits either one of the levels
Why should you learn this ?
- 🤑 Your trading results will improve
- 😊 You will have confidence in your trades
- 🍻 You will be able to relax
If you don't learn this
- Doubts
- Constantly fearful of price reversing
- Believe that every bull-back in the end of the move
- Beat yourself up when price resumes its journey to target after the stop loss
- Beat yourself up when you didn't move your stop level after being in profit on the trade and the original stop gets hit
- Berate yourself after nearly every trade
- Unable to win emotionally
Once you learn it
- Let your trades run with full confidence that you are following a structured plan that will ultimately make you a more profitable trader
- Fully relax during open live trades
- Trust you exit plan implicitly
- Not be tempted to tinker with your stop loss and take profit levels
Steps
- Double check the SL & TP positions
- Re-analyse roadblocks
- Relax and enjoy the trade
Step 1: You can't rewind the market
Your goal: Double check the accuracy of your stop loss and take profit levels
These are price levels that you will exit your trade at,so it is essential that they are perfectly positioned
What do you need to do ?
-
Review the TP level:
- Is it on the correct side of the PCL ? have you taken into account the broker spread ?
- When longing, the take profit must be < PCL (because if it hits the SL, we're selling out of the trade, so we sell at the bid price, which is exactly where the line is drawn.)
- Note: In the video, Simon subtracts the spread from the TP in a long trade. I think he's wrong though in this instance.
- When shorting, the take profit must be > PCL - spread, because we buy out of the trade, which is at the ask price, which is above the line we see on the chart, (reducing your profit)
-
Review the SL level:
- Is it in line with your aggressive or cautious attitude to stop loss placement?
- Is it far enough behind the setup pattern / right shoulder / head, taking into account the broken spread ?
- When longing, the SL must be < the stop-loss pattern - spread. Suppose the SL is set at $50 and the spread is $1, you'll get stopped out at the price of $51, so you should draw your actual stop-loss at $49, so it'll actually be $50
- When shorting, the SL must be just > the stop-loss pattern (because the bid price you see at the chart, is the same as what you'll get when you get stopped out).
-
Ensure that risk to Reward is positive: (better than 1:1)
Step 2: Avoid roadblocks
Your goal: Reassess you roadblock analysis
In the busy period before trade execution it is easy to miss, or incorrectly analyse the presence of roadblocks that may prevent price smoothly to target.
Therefore, you need to double check that your pre-trade roadblock analysis was accurate.
To do this:
- Go through the full process detailed in the previous module "roadblocks".
- Go to your economic calendar to unsure that there aren't any relevant high impact economic news announcements due in the expected trade open window.
Don't skip this step! It is easy to think that everything is done once you press the button to open the trade, but it isn't!
Following this process will give you full peace of mind that the trade is setup, as well as it is possible to do, and that you will be able to relax thereafter confident that you couldn't do any more.
Step 3: Chillax
Being nervous drains your brain and energy. You've followed the rules. Just relax.
How do you do it?
- Stop watching the trade
- Go do something else.
- If you can analyse other trades, go ahead, but don't be tempted
- It is literally important to have no 2nd guesses; just move on with your life.
- If you go back and tinker with the trade, that's even worse; you're cutting into your profit.
Challenges you may face
- Doubt of your analysis: Trust yourself. Trust the rules. Trust the system.
- Overwhelming need to move you SL: Look at your trade log. Notice how the original SL is best in the long run.
- You'll think that every retracement is the end of the move: Don't. Do follow the rules.
- You may get too attached to a trade and move your stop further away: Imagine the trade as an employee. You've set them up for success as best you can. Now just let them sink or swim.
- Compelled to watch the trade continuously: You've created the trade, according to the rules. Just let it run its course.
How to keep consistent
- Add "double check exit levels" and "double check roadblocks" to your checklist.
- If you've followed all the rules perfectly, you've made the perfect trade
- Put a check-mark in your trade journal
Stages
Beginner
- Rarely double checks
- Missed checks and miss-analysis
- Emotionally attached to trades
Intermediate
- Often double checks
- corrects errors when identified
- Mostly leaves the trade alone and rarely makes adjustments
Advanced
- Always double checks the trade
- Always Corrects errors
- Always emotionally detaches themselves from the trade
- Confident that they have done all they can and will ultimately be successful, no matter what this trade does
Review
- Check your SL:
- Matches ATR
- Includes spread
- Check TP:
- Matches ATR
- Includes spread
- Re-analyse any support and resistance levels
- weekly trend lines
- Adjust as necessary
- In extreme cases, close the trade
- Relax, and let the trade run
When to move the neckline
If you get a high after the right shoulder, where:
- The highest high of the new shoulder is higher than the highest high of the previous shoulder .. and...
- The highest candle body of the new shoulder is higher than the highest candle-body of the old shoulder.
- If you're already in a trade, and this happens, stay in the trade
- If you haven't entered yet, redraw the neckline and re-asses.
Wait for the trade to come to you
There will be more than 1 entry candle to a trade.
It pays to wait for the perfect setup.
Better to miss out on trades than enter bad trades.
Be patient, and wait for the market to come to you.
Hedge Trades
It's perfectly ok to trade up and down on the same instrument at the same time.
Usually one would be in a smaller time frame than the other.
It can also, even be on the same time frame.
This allows you to grab 2 grade A setups at the same time.
You can even mix patterns, M/W/H&S/IH&S.
Example
If you're in a short trade on EUR/USD in 1 hour time frame, and you see a 15 minute bullish trade on the 15 minute, take both.
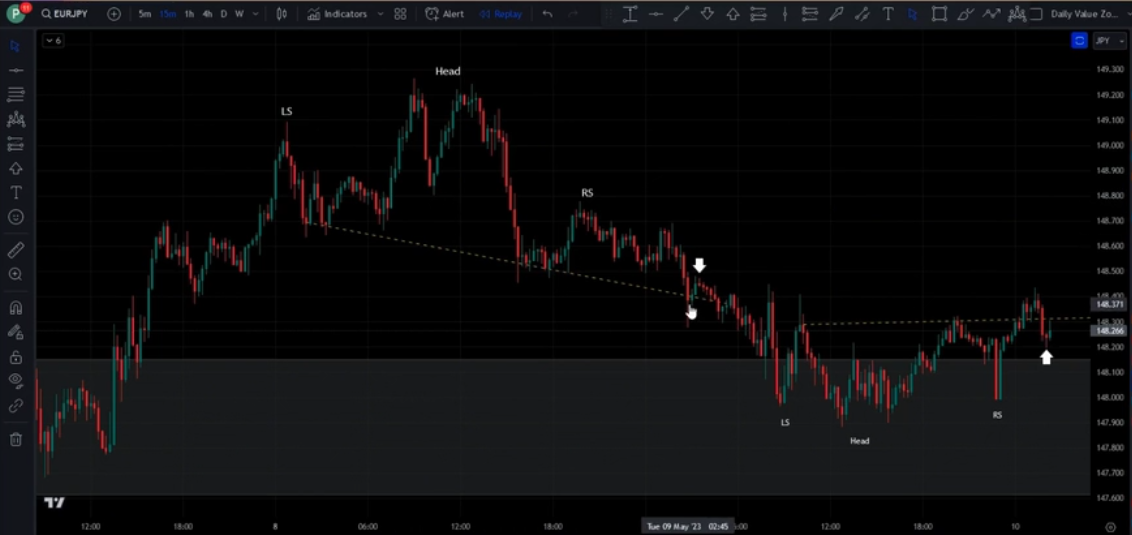
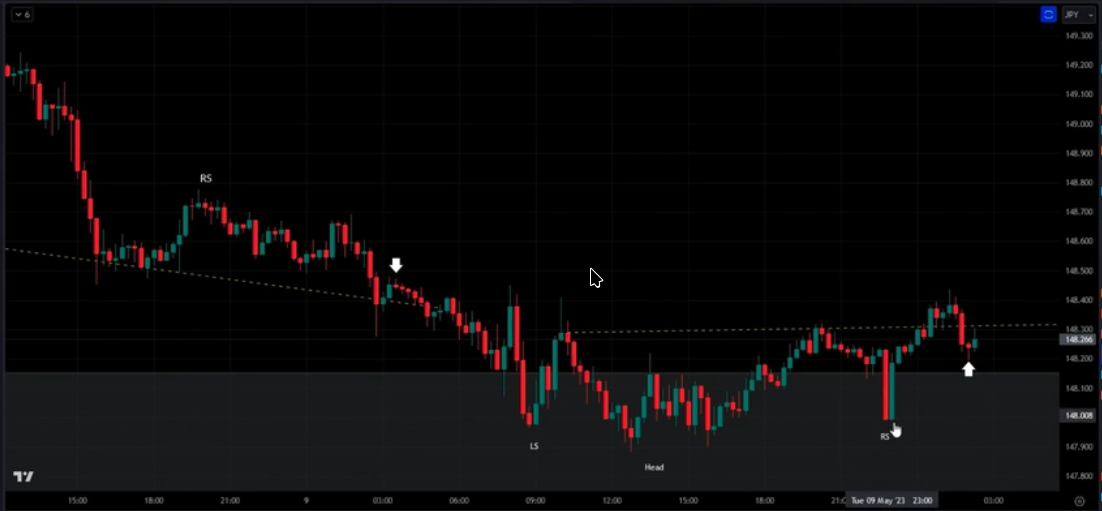
Note
All trades are treated as 100% independent.
Divergence
When an oscillator like RSI has high and low peaks move up/down, and the price peaks move in the opposite direction.
There's a video about it in the academy classroom.
There are different types:
- Regular
- Hidden
Bearish divergence up to the head, helps a trade.
The longer period of time, and the more far apart the price action ends == more powerful.
Add taking divergence to your checklist.
If there's significant divergence, you can increase the risk on the trade.
Inefficient Candles
Larger than normal candles, where price has never returned to its 50% position.
The candle immediately before the inefficient candle can square it up, or any candle after it.
Price Magnet Effect
Inefficient candles act as a magnet - price tends to return to "square them up" (reach the 50% level).
In your trade direction (beyond PCL): These are in your favour. If an unsquared inefficient candle sits slightly past your PCL, you can extend your TP to just before its 50% mark. This improves your risk to reward ratio.
Against your trade direction (between entry and PCL): These can work against you. An opposite-direction inefficient candle very close to entry creates high reversal risk - consider passing the trade. However, if it's further away toward the PCL, it's less of a concern.
Key Points
- Inefficient candles in your trade direction = targets (price magnets that help your trade)
- Inefficient candles against your trade direction, very close to entry = potential roadblocks
- If there's a resistance/support line before the inefficient candle, don't push your luck. Keep the take profit just short of the S/R line. Better to be safe and consistent.
Not a Roadblock by Default
Inefficient candles are primarily opportunities to extend targets, not obstacles. Only treat them as roadblocks when:
- They're in the opposite direction to your trade, AND
- They're very close to your entry point
Value zones
These are price levels (zones) that large Institutions recognise as representing value to buy or to sell at!
If price moves down into one of these levels - Institutions see this as a potential discounted buy level.
If price moves up into one of these levels - Institutions see this as a potential area to sell at a premium.
These levels don't disappear; they stay in the chart for years.
They aren't brick walls; they don't halt the price every time they're hit, but they do affect price most of the time.
Search for these on the daily chart only.
You want to see a price movement pattern like this (for a downtrend):
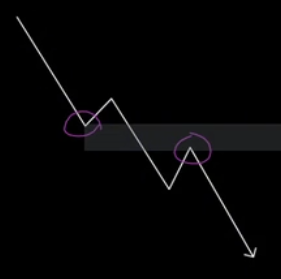
.. or like this in an uptrend:
Some rules:
- All 5 movements must be present and confirmed with price closes Each leg has to actually close higher/lower than the previous to be valid.
- There can't be any overlap between the pivot points.
- Draw the zone from the body of the pull-back candle, to the body of, 2nd pull-back candle
- There should be some white space (at least one candle where no candles nor wicks are touching the zone), between the first pull back candle, to the push-through candle.
- Same whitespace rule after the push-through up to the 2nd pull-back and bounce
- Older zones can have their effect can be easily seen; newer zones have yet to prove themselves
- The zone should be quite short (not too high).
- For currency pairs, no more than 1.5% of the price. (The number in brackets in the ruler tool).
- For volatile currency pairs, like EUR/GBP, 1%
- For Indices, 2.5%
- For commodities, 3%
- After drawing the zone, we have to validate it. Note the sell-off as price hits the zone the 2nd time with just a big wick:
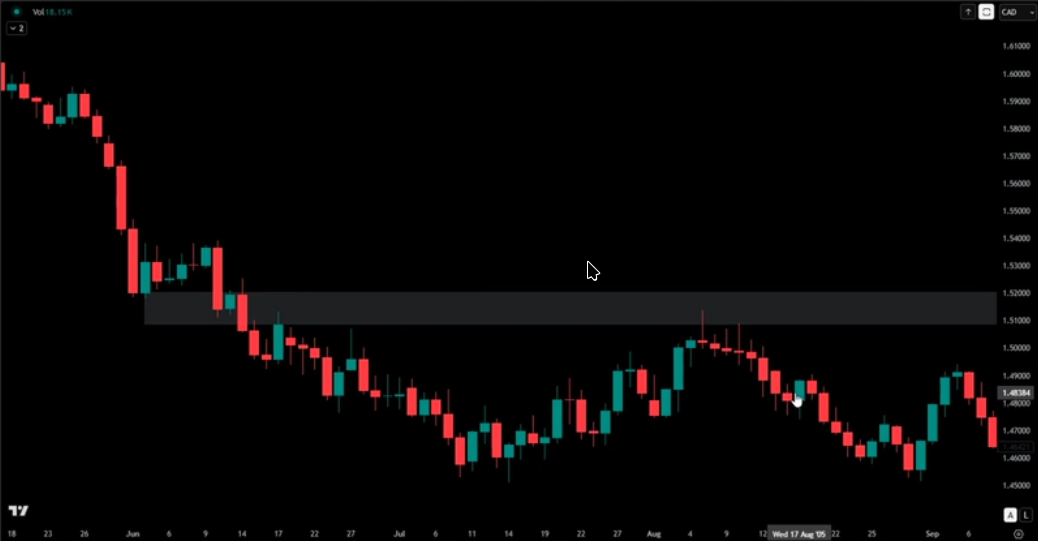 That zone was drawn in 2005. Here in 2007 it's hit again. not that it pushes through, then bonces off it several times:
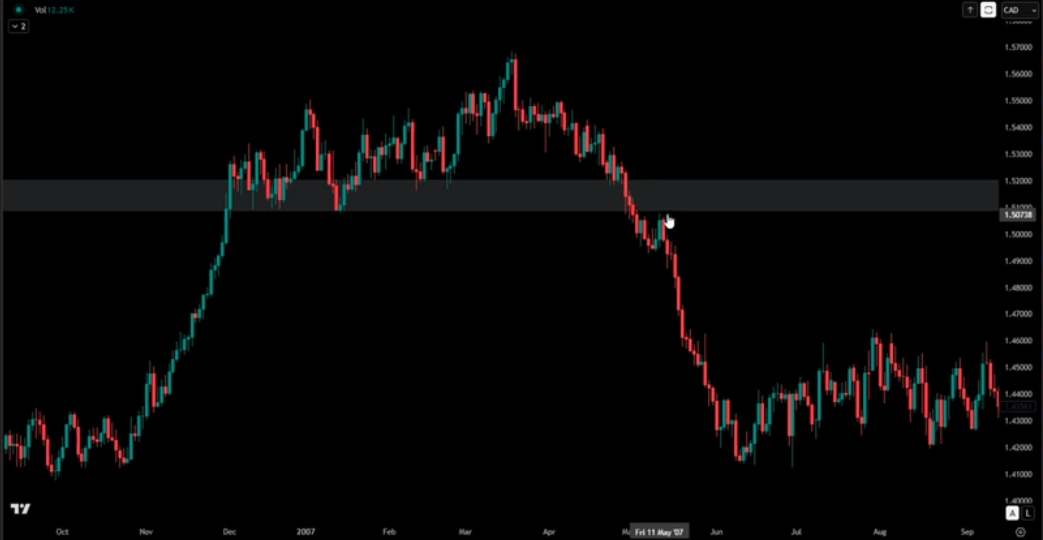
- If you find the zone is not respected, change its colour and mark it as "on-probation". Later, if it fails to continue respecting, remove it from the chart.
The top two zones are ok, but the bottom one is too tall. The bottom one is still respected but it's too tall to add value to our trades:
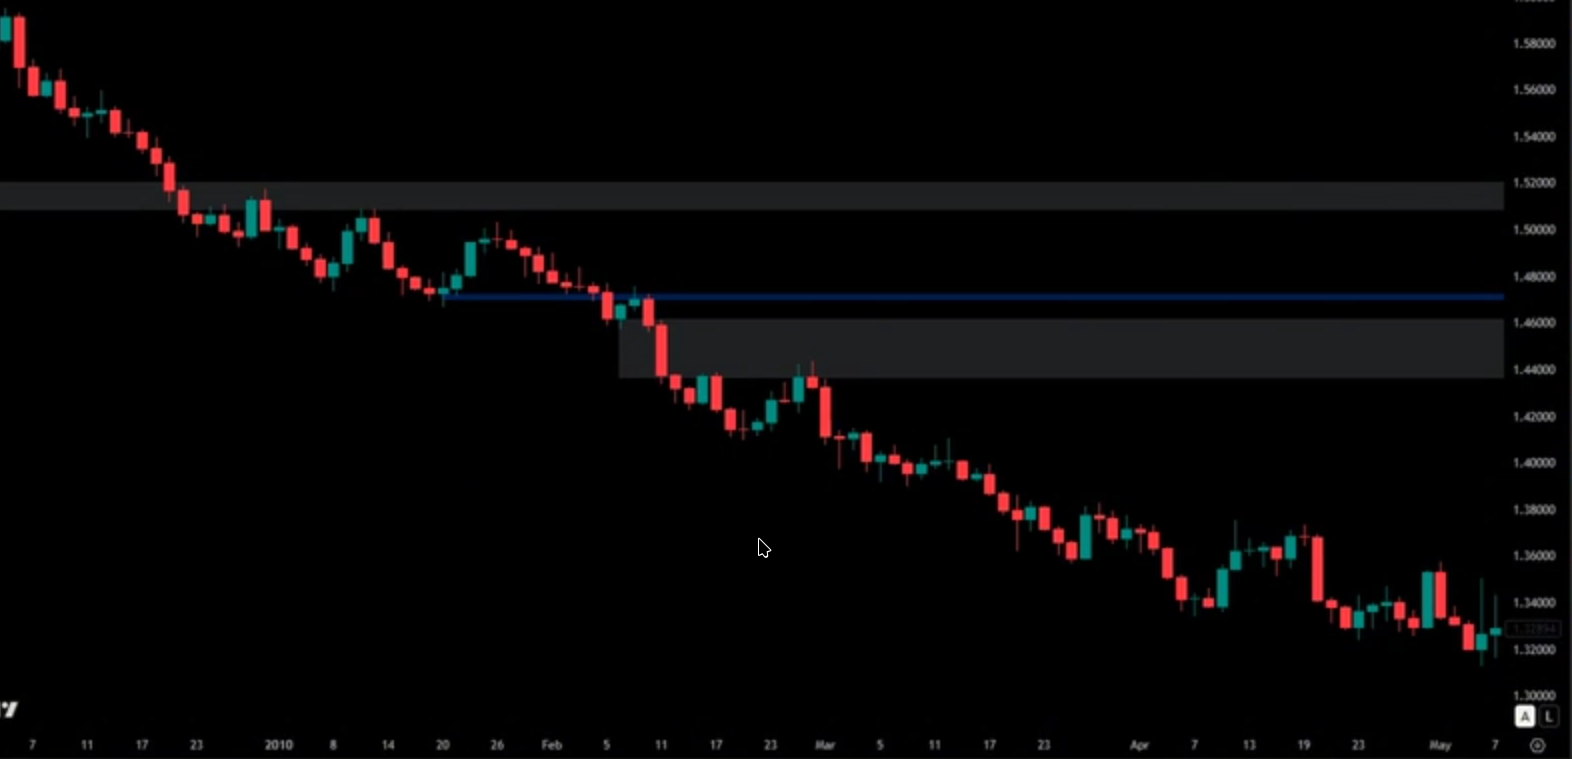
Invalid zone
The bottom zone is valid, but right on the limit of tallness.
The top zone is invalid, because the 2nd bounce-off doesn't go higher than the push-through run:
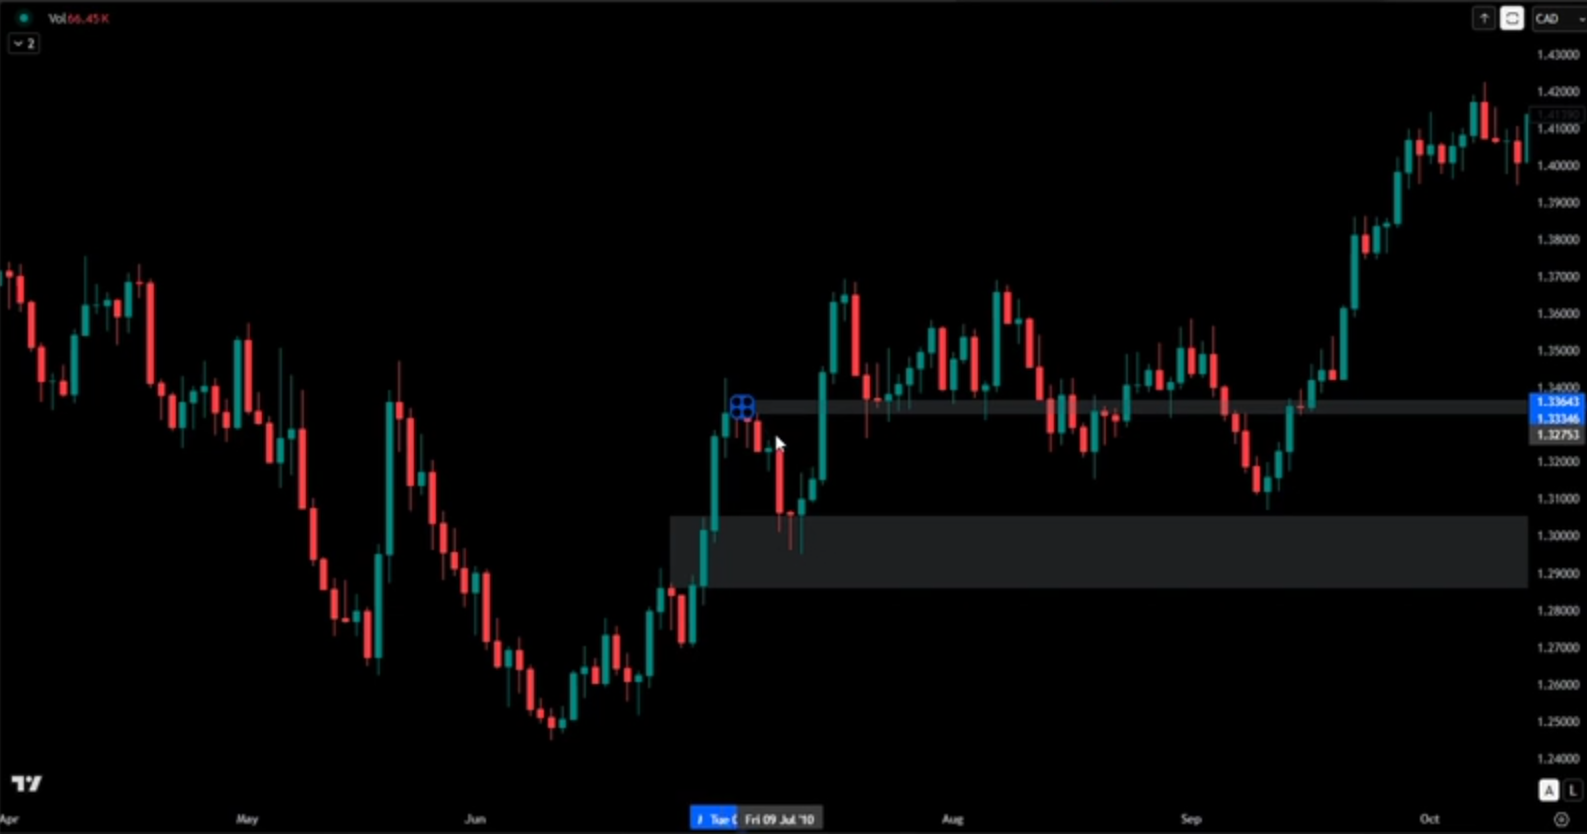
Funky zone
This zone's arrows look a bit extreme, but it is valid.
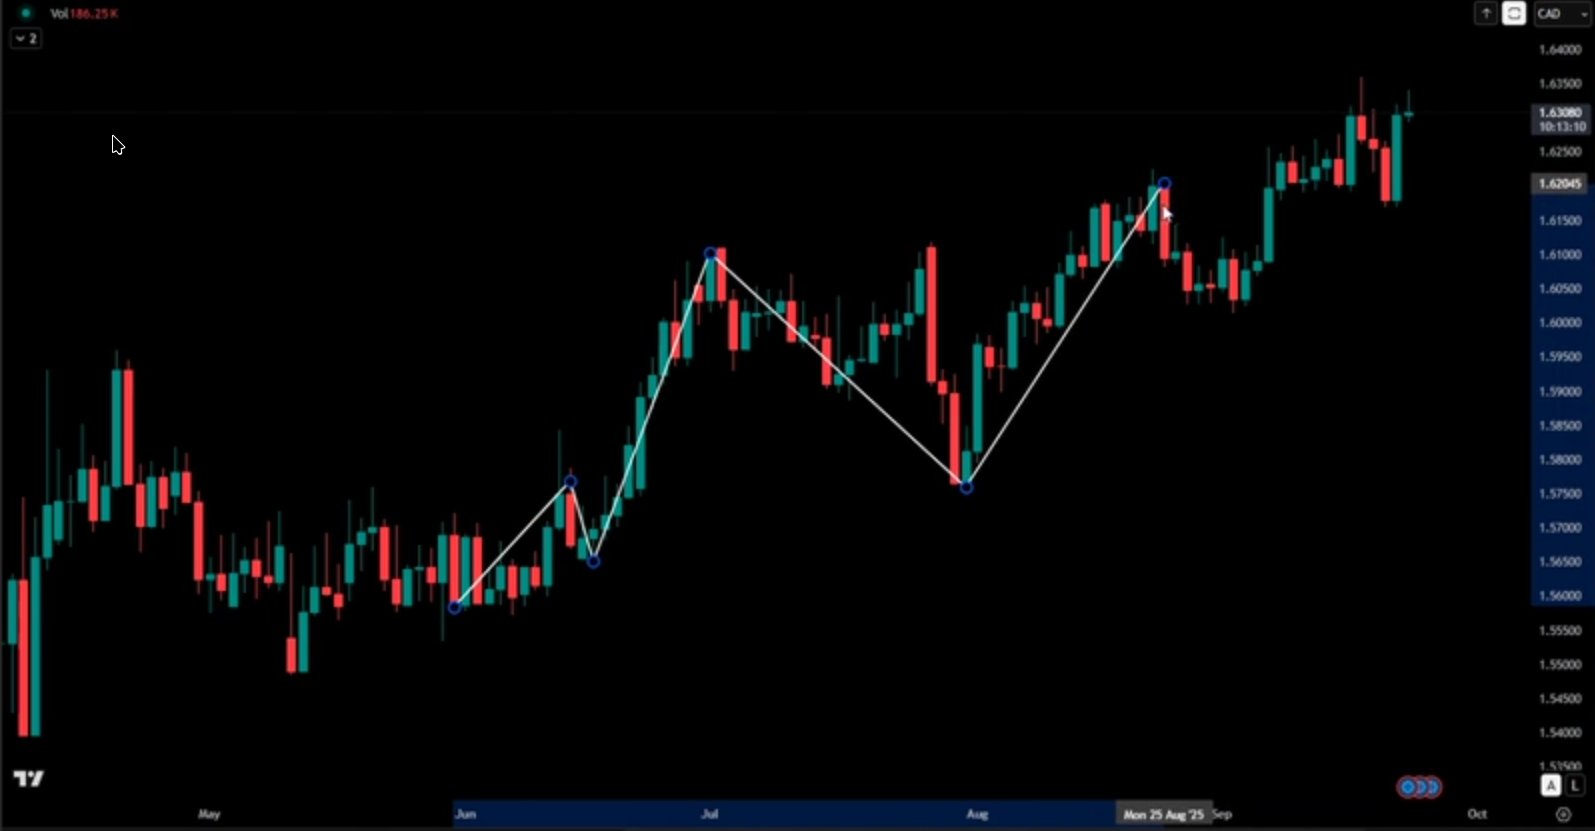
Because this zone is so new, we can't extend it right to validate it, so we extend it left instead.
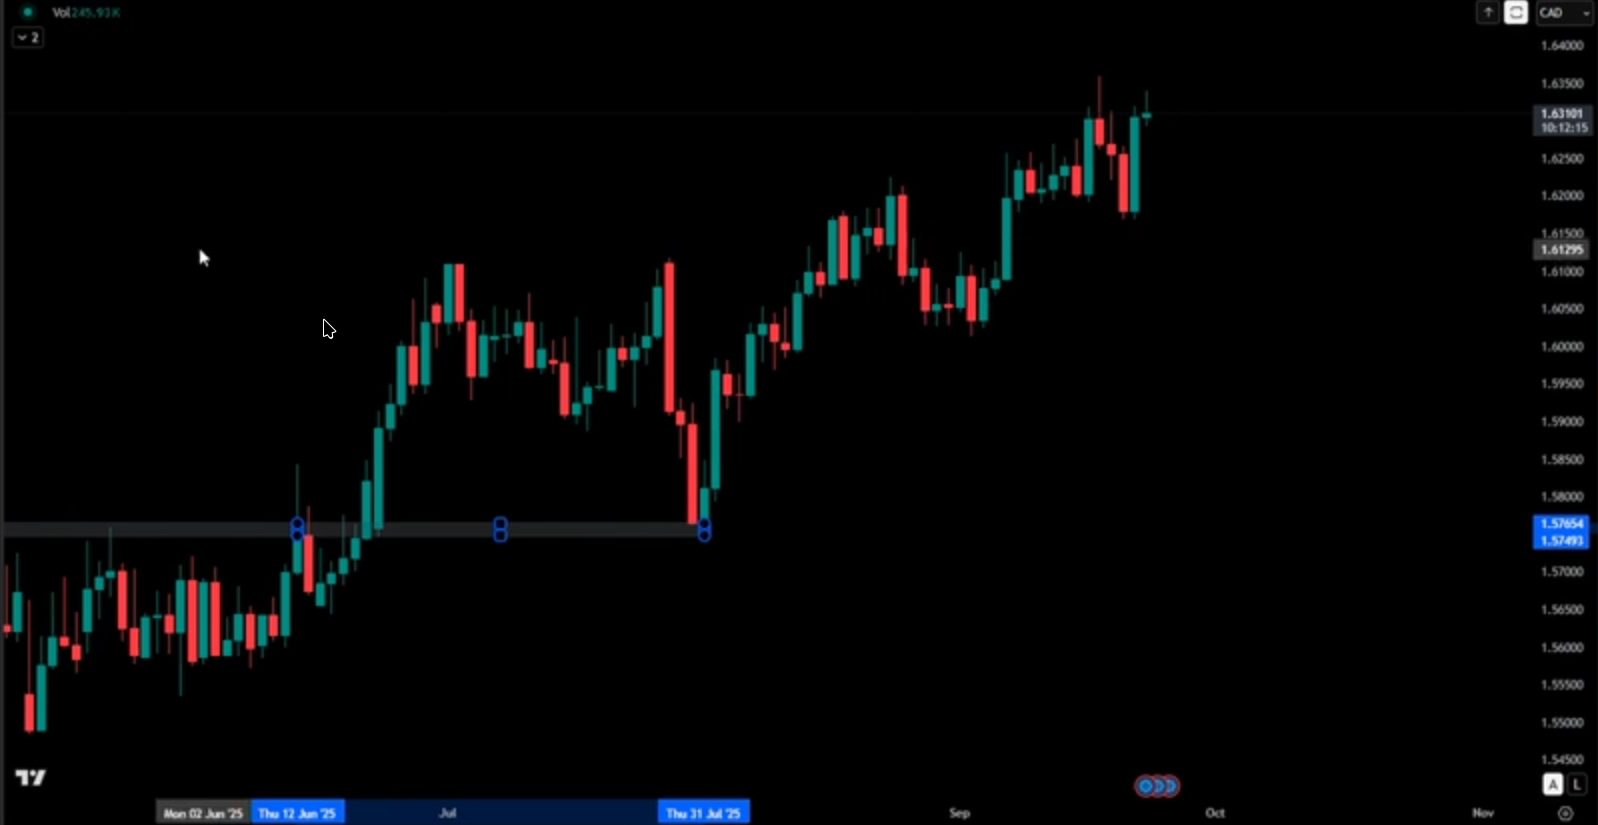
US Oil example
Arrows
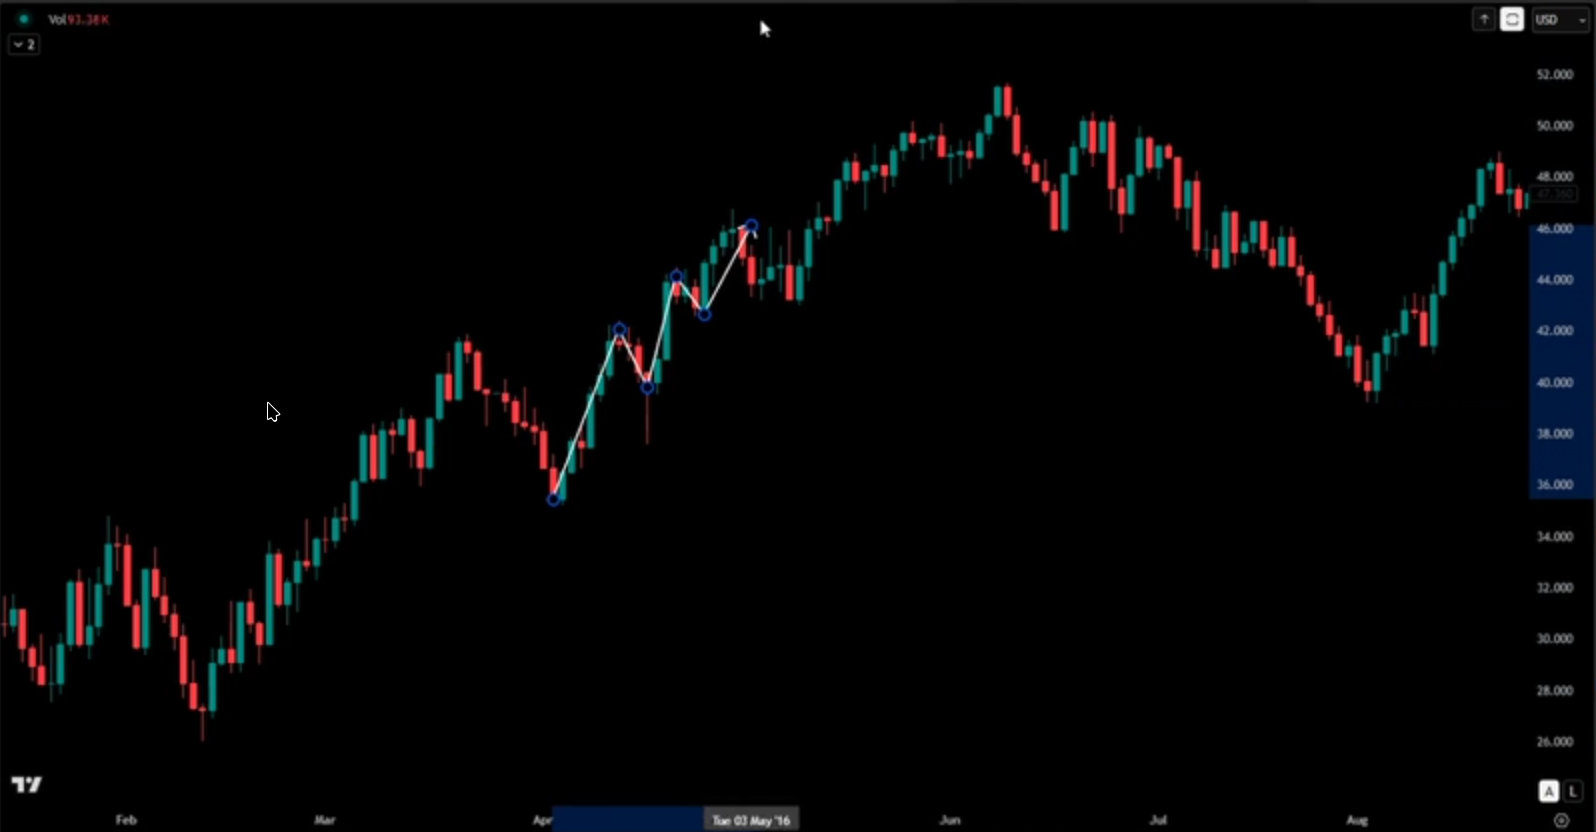
Draw
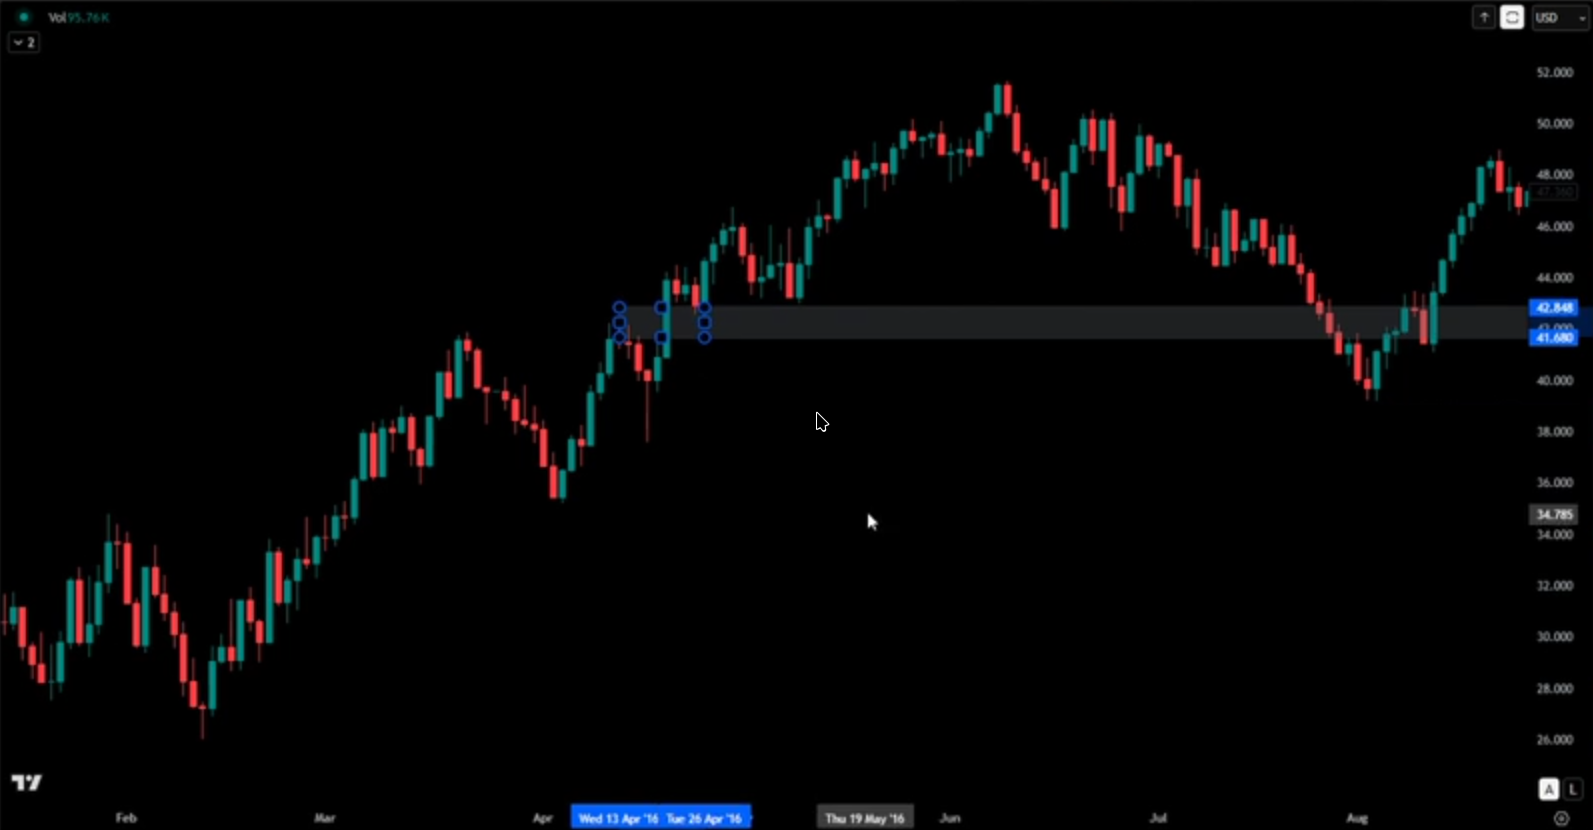
Validating
Looks to be well respected.

Trying again
If you fail in a trade, and the pattern is still valid, you can try again.
This is the story:
- We got an engulfer entry, and took it short, with an aggressive stop loss - it stopped out. Lost 1%.
- We got a pin-candle entry, same thing happened. Lost 1%.
- We got another engulfer. This one went to target and made 8%
If the pattern is still valid and you get another entry, why not take it
So it seems that getting a new shoulder, even if you can't move the neckline, doesn't invalidate the pattern.
If you used the head as the stop loss, you'd only have made like 1.5%.
The more aggressive stop loss is more profitable, but takes more resilience and trust in the pattern and system.
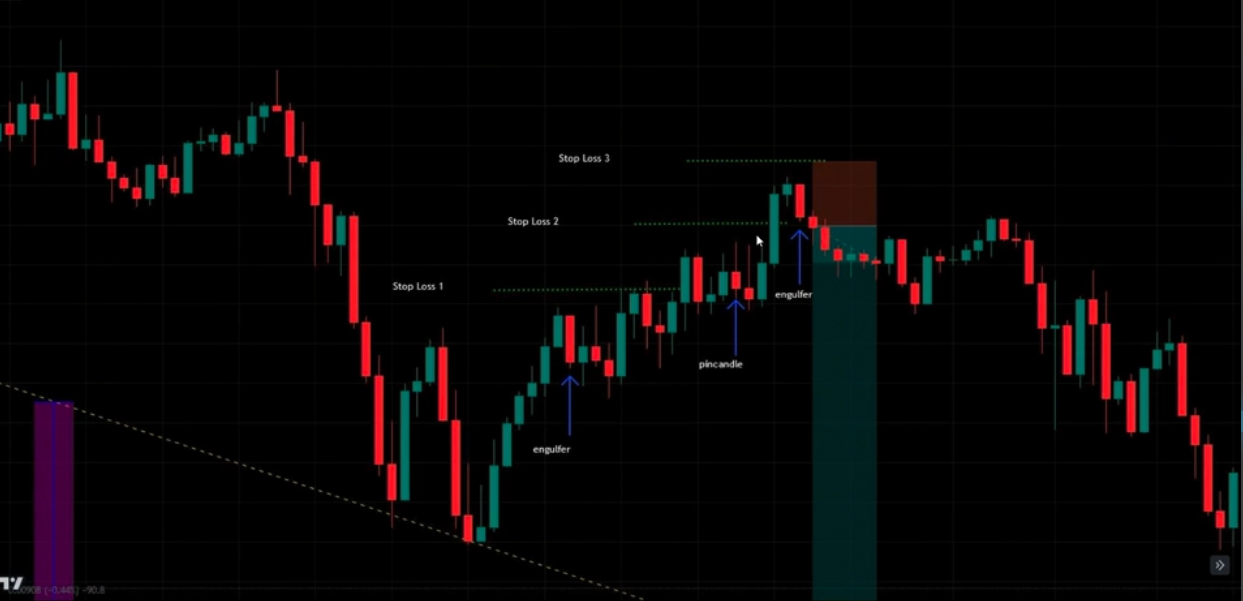
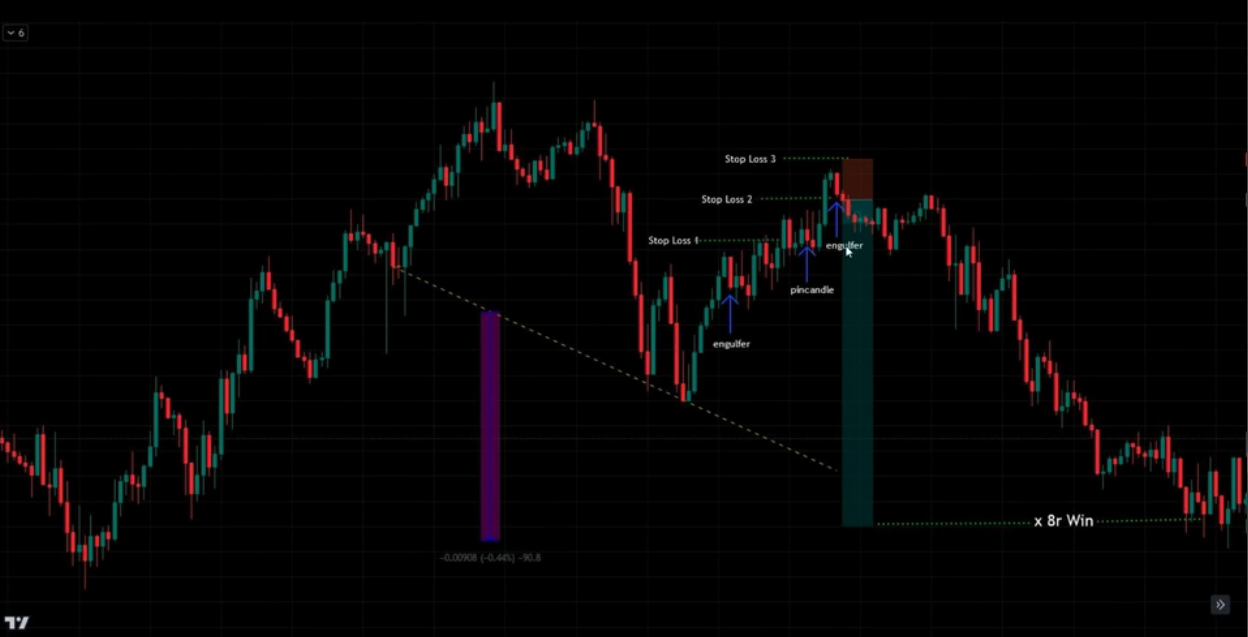
Floating engulfer
A normal bullish engulfer is a red candle, followed by a green candle, that completely engulfs the body of the previous candle.
A bullish floating engulfer is a green candle, followed by another green candle, that completely engulfs the top wick of the previous candle.
Rules:
- Same colour as previous candle
- Needs to close above the high of the previous candle
- Needs to close within the top 25% of its range
Close enough retest
It doesn't actually have to touch the neckline to get a retest.
The longer it has been since the break and close, the further away the retest is allowed to be.
In this example, only the last wick counts, because it's far away and close enough.
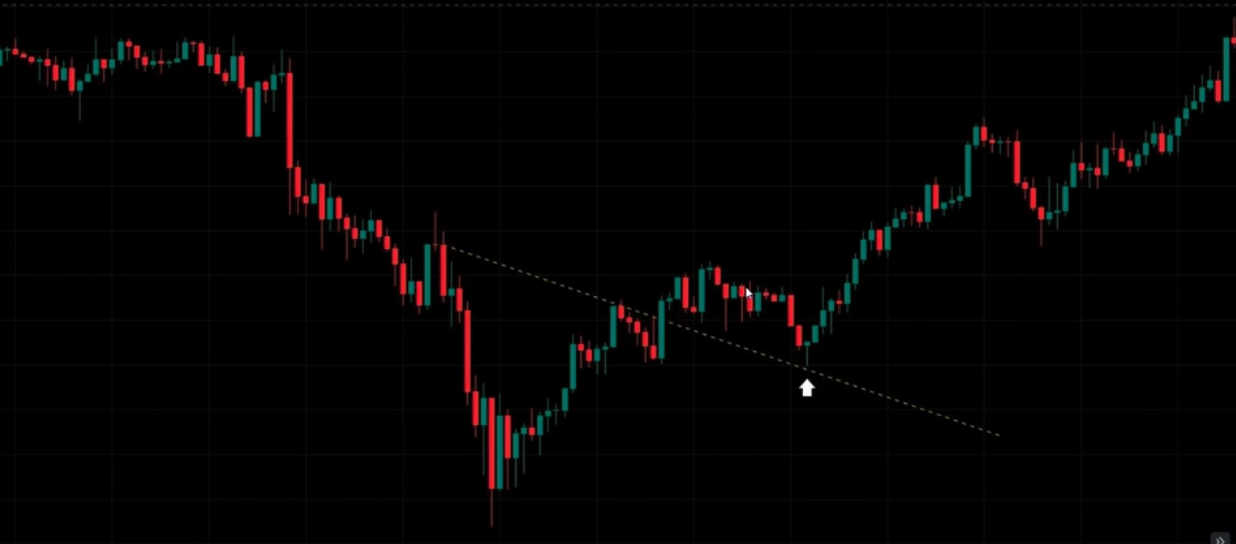
Zoomed in:
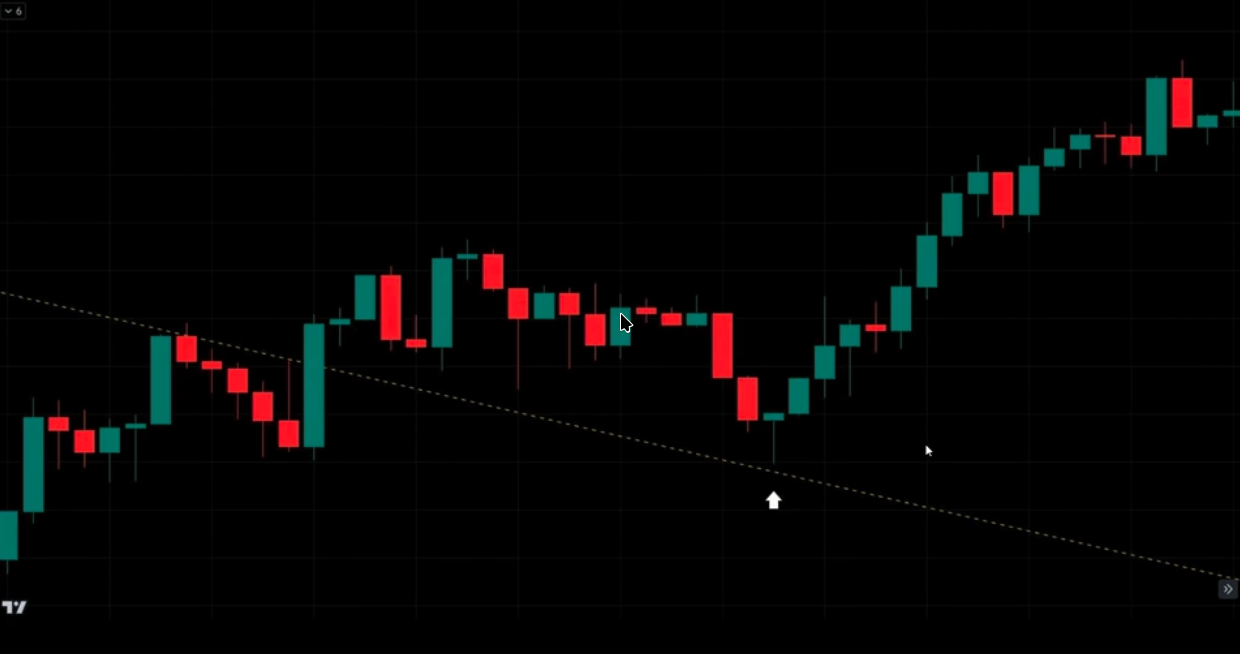
Stocks
Stocks often behave differently to forex and commodities.
- Wait for a valid neckline to be drawn
- On the very 1st break enter the trade with 50% of your normal trade size
- Enter the 2nd 50% if you get a full BCR
- Don't use the super aggressive stop-loss with stocks. Stop loss should be only behind the head or the right shoulder. Not above the entry candle pattern.
This is because stocks move very fast and may not come back.
Quasimodo-entry
- Draw a valid neckline
- Confirm that it is steeply angled
- Down for H&S
- Up for IH&S
- Wait for price to return to approximately the same level as the high/low of the left shoulder
- Look for entry setup candles and enter the normal fashion
(Just wait for the top of the shoulder, then straight in).
In this example, the right-shoulder retrace is close enough to the left shoulder. From this point on, we can look for entry candles.
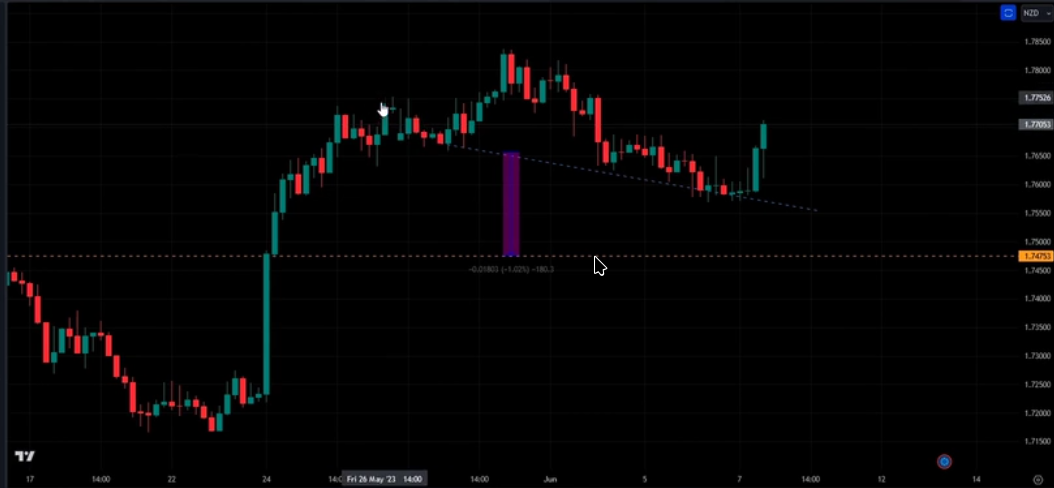
Enter in that red pinbar near the end:
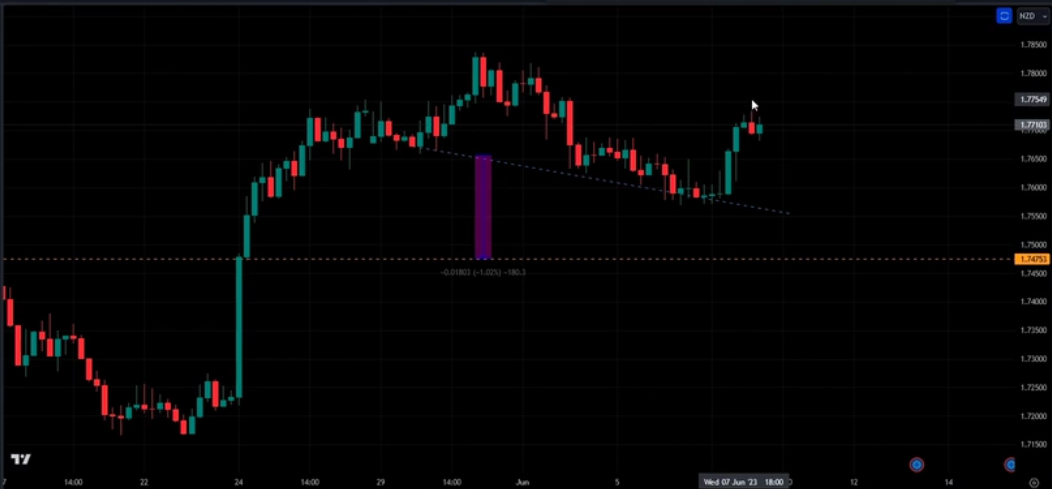
We won! It did get an actual entry in the end, but the quasimodo entry gets a better risk to reward ratio.

The reason this is allowed is because we have a break of structure.
The start of the neckline is a low
Because the neckline is sloped downwards, the bottom of the right shoulder neckline close, will be a lower low.
You don't need a close below, but it is preferred.
Right Shoulder Level Requirement
For Quasimodo entries, the right shoulder must retrace back to roughly the same level as the left shoulder.
- It doesn't have to be exact - just "into the vicinity" of the left shoulder level
- The right shoulder can go higher than the left shoulder, but cannot breach the head
- Once the right shoulder reaches approximately the left shoulder's level, you can look for entry candles
- Entry opportunities exist from the left shoulder level all the way up to (but not exceeding) the head
Candle Count for Quasimodo
Because there's no early break of the neckline in Quasimodo entries, the candle count measurement is different from standard H&S:
- Minimum: 20 candles
- Measurement: From the left of the left shoulder (drawing a horizontal line left as in the standard method) to the highest point of the right shoulder (or lowest point for inverted H&S)
This is shorter than the standard 30-candle minimum because the pattern confirms earlier via the break of structure.
EUR/AUD IHS example
You couldn't enter in that first right shoulder, but the second right shoulder is close enough.
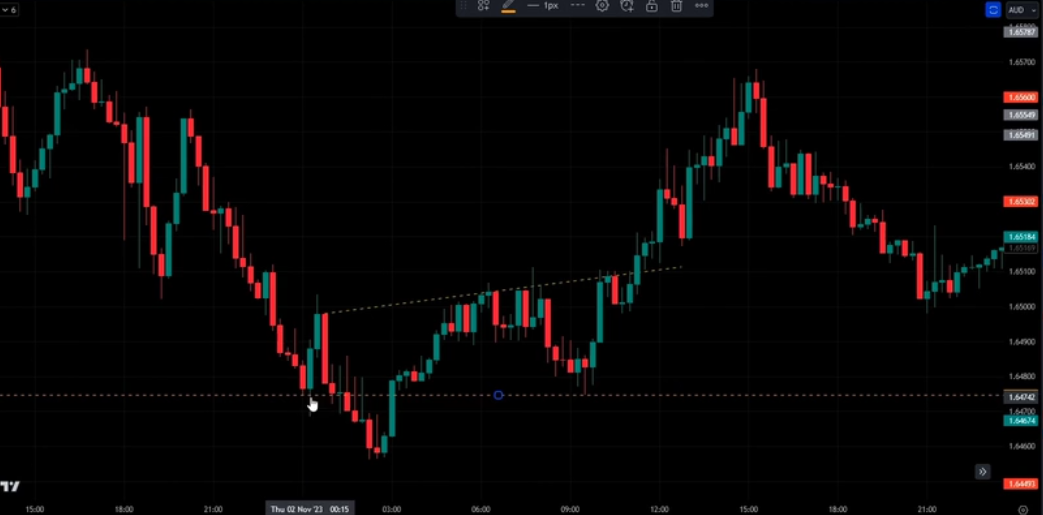
Win! Try to look for 3:1 minimum for super aggressive stop losses.
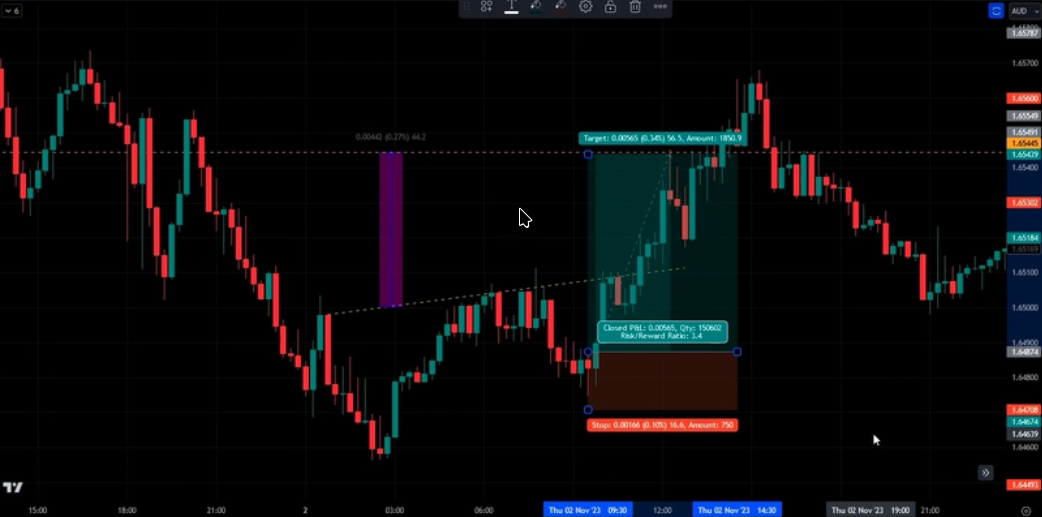
Documenting your trades
You'll soon be able to...
- Document & record your trades to provide valuable insights into your trading efficiency
- Quickly identify your trading strengths & weaknesses
You'll learn
- What to include in your trade log / journal
- How to document it
- How to analyse the valuable information it dispenses
Why should you learn this
To improve your trading skills, you need to analyse your trading performance
- Promotes discipline
- Helps mental well-being
- Invaluable performance metrics
If you don't learn how to document your trades
- You'll be less disciplined as a trader
- You'll be trading semi blind
- Your confidence will erode when you have a losing run
What it will be like, you can..
- Analyse trading performance
- Elevate you trading to a new level
- Become comfortable & fully accepting of a losing run
- See system isn't broken & winning trades prevail
Steps
- Select metrics
- Open and name spreadsheet
- Input metric headings
- Populate with trade details
- Analyse
Step 1: Decide what metrics to include
- basics
- Date
- Day of week
- Time
- Instrument
- Pattern
- Other metrics
- Factors that add value to the trade
- Divergence
- Value zone
- Factors that adversely affect the probability of success
- Road block
- Results
- Notes
- Link / Pic
- Factors that add value to the trade
Spread hours (Jan-Jun)
OANDA Spread Analysis by Hour
Analysis of spread patterns across all OANDA instruments, based on one week of hourly candle data. All times are in Brisbane timezone (UTC+10).
Key Findings
Volume and Spread Correlation
There is a moderate negative correlation (-0.324 average) between trading volume and spread across most instruments:
- 77% of instruments show negative correlation (low volume → higher spreads)
- 24% show strong negative correlation (correlation < -0.5)
- Crypto and some exotic pairs show weak/no correlation
Implication: Avoid trading during low-volume hours to minimise spread costs.
The 07:00-08:00 Brisbane Problem
For most forex pairs, 07:00-08:00 Brisbane time (21:00-22:00 UTC previous day) has significantly elevated spreads. This corresponds to the gap between Tokyo market close and London market open.
Hours to Avoid by Instrument Category
Major Forex Pairs
| Instrument | Avg Spread (pips) | Avoid Hours | Spread Multiplier |
|---|---|---|---|
| EUR_USD | 1.75 | 08:00 | 2.4x |
| GBP_USD | 2.34 | 07:00, 08:00 | 2.5-3.7x |
| USD_JPY | 1.88 | 07:00, 08:00 | 2.0-2.9x |
| USD_CHF | 1.78 | 07:00, 08:00 | 2.2-3.9x |
| AUD_USD | 1.45 | 07:00 | 2.5x |
| USD_CAD | 2.03 | 08:00 | 2.6x |
| NZD_USD | 1.62 | 07:00, 08:00 | 2.1x |
Cross Pairs
| Instrument | Avg Spread (pips) | Avoid Hours | Spread Multiplier |
|---|---|---|---|
| EUR_GBP | 1.70 | 07:00, 08:00 | 2.6-3.6x |
| EUR_JPY | 3.24 | 08:00 | 3.3x |
| GBP_JPY | 4.53 | 07:00, 08:00 | 3.1-4.0x |
| EUR_CHF | 1.89 | 08:00 | 4.0x |
| GBP_CHF | 3.36 | 07:00, 08:00 | 3.1-4.5x |
SGD Pairs (Worst Offenders)
SGD pairs have the most extreme spread spikes:
| Instrument | Avg Spread (pips) | Avoid Hours | Spread Multiplier |
|---|---|---|---|
| AUD_SGD | 3.15 | 07:00, 08:00 | 4.0-4.2x |
| CAD_SGD | 2.86 | 07:00, 08:00 | 4.3-4.4x |
| EUR_SGD | 4.11 | 07:00, 08:00 | 4.0x |
| GBP_SGD | 5.07 | 07:00, 08:00 | 4.3-4.7x |
| USD_SGD | 2.68 | 07:00, 08:00 | 4.1-5.1x |
| SGD_JPY | 2.99 | 07:00, 08:00 | 4.7x |
Precious Metals
| Instrument | Avoid Hours | Notes |
|---|---|---|
| XAU_USD | None | Relatively stable spreads |
| XAU_AUD | 07:00 | 2.2x spike |
| XAU_CAD | 07:00 | 2.2x spike |
| XAU_EUR | 07:00 | 2.2x spike |
| XAG_* | None | Silver pairs stable throughout |
Indices
| Instrument | Avg Spread | Best Hours | Notes |
|---|---|---|---|
| NAS100_USD | 18876 | 01:00-06:00 | 42-58% of average during US hours |
| SPX500_USD | 4792 | None | Relatively stable |
| US30_USD | 29130 | 06:00 | 71% of average |
Good Trading Hours
Best Hours (Spread ≤ 75% of Average)
Most major forex pairs have tight, stable spreads without significant "best" hours. However, some instruments show clear optimal windows:
GBP_JPY: 01:00-06:00, 17:00, 19:00, 21:00-23:00 Brisbane
NAS100_USD: 01:00-06:00 Brisbane (aligns with US market hours)
AU200_AUD: 09:00-15:00 Brisbane (Australian market hours)
EUR_CZK: 01:00 Brisbane
Recommendations
For Automated Trading Systems
- Implement time-based spread filters - reject trades during high-spread hours
- Use the JSON data file (
spread_analysis.json) for programmatic access - Consider volume as a proxy - low volume often predicts high spreads
For Candle Pattern Analysis
Exclude candles from high-spread hours when:
- Detecting reversal patterns (spread affects apparent candle size)
- Calculating support/resistance levels
- Training ML models on price action
Hours to Always Avoid (Brisbane UTC+10)
For most forex trading, avoid:
- 07:00-08:00 for all pairs
- 08:00-09:00 for ZAR pairs (extended spike)
- 16:00-17:00 for TRY pairs
Data Reference
Spread Threshold Definitions
| Category | Threshold | Meaning |
|---|---|---|
hours_gte_4x_avg | ≥ 4x average | Extremely high - never trade |
hours_gte_3x_avg | ≥ 3x average | Very high - avoid |
hours_gte_2x_avg | ≥ 2x average | Elevated - caution |
hours_good_lte_75pct_avg | ≤ 0.75x average | Good conditions |
hours_best_lte_half_avg | ≤ 0.5x average | Optimal conditions |
Volume/Spread Correlation Interpretation
| Correlation | Meaning |
|---|---|
| < -0.5 | Strong negative - volume strongly predicts spread |
| -0.5 to -0.2 | Moderate negative - volume somewhat predicts spread |
| -0.2 to 0.2 | Weak/none - spread independent of volume |
| > 0.2 | Positive - unusual, investigate further |
Files
spread_analysis.json- Complete data for all instruments (machine-readable)spread_data_with_volume.csv- Raw hourly data with volumeexamples/spread_by_hour.rs- Rust code to regenerate this analysis
Methodology
- Data source: OANDA v20 API (practice environment)
- Period: Last 7 days of hourly candles (168 candles per instrument)
- Spread calculation: Ask close - Bid close for each candle
- Timezone: All hours converted to Brisbane (UTC+10)
- Pip conversion: ×10000 for most pairs, ×100 for JPY pairs
Generated: January 2026 Data refresh recommended: Weekly
Instrument Trading Cost Rankings
Instruments ranked by average spread as a percentage of average price. Lower percentage = lower trading cost = better for trading.
How to Read This
- Spread %: The average spread divided by the average price, as a percentage
- A spread of 0.01% means you pay 0.01% of the instrument's value in spread costs per trade
- For a $10,000 position at 0.01% spread, you pay ~$1 in spread costs
Quick Reference
| Category | Best Instruments | Spread % |
|---|---|---|
| Major Forex | USD_JPY | 0.0119% |
| Stock Indices | US30_USD | 0.0059% |
| Gold | XAU_HKD | 0.0201% |
| Silver | XAG_USD | 0.0619% |
Instrument Tiers
Tier 1: Excellent (< 0.02% spread)
| Rank | Instrument | Avg Price | Spread % |
|---|---|---|---|
| 1 | US30_USD | 49294.75116 | 0.0059% |
| 2 | USD_HKD | 7.79755 | 0.0061% |
| 3 | SPX500_USD | 6943.25582 | 0.0069% |
| 4 | NAS100_USD | 25588.63276 | 0.0074% |
| 5 | USD_TRY | 43.06858 | 0.0115% |
| 6 | USD_JPY | 158.29932 | 0.0119% |
| 7 | USB02Y_USD | 104.06361 | 0.0134% |
| 8 | DE30_EUR | 25277.46429 | 0.0142% |
| 9 | USD_CAD | 1.38874 | 0.0146% |
| 10 | EUR_USD | 1.16401 | 0.0150% |
| 11 | US2000_USD | 2642.13010 | 0.0150% |
| 12 | USB05Y_USD | 108.96570 | 0.0163% |
| 13 | EUR_DKK | 7.47189 | 0.0168% |
| 14 | HKD_JPY | 20.30116 | 0.0174% |
| 15 | GBP_USD | 1.34248 | 0.0175% |
| 16 | EUR_JPY | 184.26265 | 0.0176% |
| 17 | USD_CNH | 6.96788 | 0.0179% |
| 18 | DE10YB_EUR | 127.97030 | 0.0185% |
| 19 | UK100_GBP | 10167.57271 | 0.0185% |
| 20 | FR40_EUR | 8265.04524 | 0.0186% |
| 21 | EUR_GBP | 0.86707 | 0.0196% |
| 22 | JP225Y_JPY | 53621.37352 | 0.0198% |
Tier 2: Good (0.02% - 0.04% spread)
| Rank | Instrument | Avg Price | Spread % |
|---|---|---|---|
| 1 | XAU_HKD | 35828.68280 | 0.0201% |
| 2 | EUR_HKD | 9.07639 | 0.0202% |
| 3 | EUR_CHF | 0.93108 | 0.0203% |
| 4 | USD_SGD | 1.28705 | 0.0209% |
| 5 | EU50_EUR | 5996.39048 | 0.0209% |
| 6 | XAU_CAD | 6380.77624 | 0.0211% |
| 7 | GBP_JPY | 212.51287 | 0.0213% |
| 8 | CH20_CHF | 13406.34107 | 0.0215% |
| 9 | XAU_EUR | 3947.22547 | 0.0216% |
| 10 | AUD_USD | 0.66956 | 0.0216% |
| 11 | EUR_CAD | 1.61641 | 0.0217% |
| 12 | HK33_HKD | 26619.36379 | 0.0223% |
| 13 | USD_CHF | 0.79990 | 0.0223% |
| 14 | CAD_HKD | 5.61516 | 0.0225% |
| 15 | XAU_JPY | 727104.31988 | 0.0228% |
| 16 | XAU_USD | 4594.96613 | 0.0229% |
| 17 | USB10Y_USD | 112.18953 | 0.0229% |
| 18 | GBP_HKD | 10.46799 | 0.0230% |
| 19 | CAD_JPY | 113.99498 | 0.0234% |
| 20 | XAU_GBP | 3422.49295 | 0.0236% |
| 21 | XAU_AUD | 6862.79601 | 0.0237% |
| 22 | USD_DKK | 6.41914 | 0.0238% |
| 23 | XAU_SGD | 5913.67045 | 0.0243% |
| 24 | SGD_JPY | 122.99535 | 0.0243% |
| 25 | XAU_CHF | 3675.46049 | 0.0250% |
| 26 | JP225_USD | 53721.77725 | 0.0250% |
| 27 | XAU_NZD | 7984.98700 | 0.0255% |
| 28 | GBP_CAD | 1.86424 | 0.0256% |
| 29 | EUR_AUD | 1.73847 | 0.0257% |
| 30 | CHF_JPY | 197.90235 | 0.0263% |
| 31 | AUD_JPY | 105.99118 | 0.0265% |
| 32 | AUD_HKD | 5.22093 | 0.0267% |
| 33 | AUD_NZD | 1.16336 | 0.0272% |
| 34 | CHF_HKD | 9.74826 | 0.0273% |
| 35 | EUR_SGD | 1.49813 | 0.0274% |
| 36 | NZD_USD | 0.57554 | 0.0282% |
| 37 | AU200_AUD | 8816.49449 | 0.0293% |
| 38 | GBP_SGD | 1.72782 | 0.0294% |
| 39 | CAD_SGD | 0.92683 | 0.0309% |
| 40 | GBP_CHF | 1.07384 | 0.0312% |
| 41 | USD_MXN | 17.79351 | 0.0315% |
| 42 | GBP_AUD | 2.00501 | 0.0318% |
| 43 | AUD_CAD | 0.92979 | 0.0332% |
| 44 | UK10YB_GBP | 92.73810 | 0.0333% |
| 45 | SGD_CHF | 0.62150 | 0.0347% |
| 46 | NZD_JPY | 91.10731 | 0.0350% |
| 47 | AUD_CHF | 0.53558 | 0.0352% |
| 48 | NL25_EUR | 988.92136 | 0.0353% |
| 49 | CAD_CHF | 0.57602 | 0.0356% |
| 50 | USB30Y_USD | 116.04194 | 0.0357% |
| 51 | AUD_SGD | 0.86176 | 0.0365% |
| 52 | XCU_USD | 5.88410 | 0.0373% |
| 53 | EUR_TRY | 50.43488 | 0.0375% |
| 54 | EUR_NZD | 2.02248 | 0.0378% |
| 55 | NZD_HKD | 4.48782 | 0.0392% |
| 56 | NZD_CAD | 0.79924 | 0.0392% |
Tier 3: Acceptable (0.04% - 0.08% spread)
| Rank | Instrument | Avg Price | Spread % |
|---|---|---|---|
| 1 | NZD_SGD | 0.74074 | 0.0416% |
| 2 | EUR_NOK | 11.73390 | 0.0416% |
| 3 | NZD_CHF | 0.46037 | 0.0433% |
| 4 | EUR_CZK | 24.27094 | 0.0434% |
| 5 | GBP_NZD | 2.33255 | 0.0440% |
| 6 | USD_CZK | 20.85118 | 0.0448% |
| 7 | EUR_SEK | 10.71523 | 0.0454% |
| 8 | USD_NOK | 10.08069 | 0.0471% |
| 9 | BTC_USD | 93617.32440 | 0.0474% |
| 10 | USD_SEK | 9.20550 | 0.0502% |
| 11 | ESPIX_EUR | 17575.17619 | 0.0512% |
| 12 | EUR_PLN | 4.21479 | 0.0526% |
| 13 | CN50_USD | 15382.12493 | 0.0538% |
| 14 | CHINAH_HKD | 9188.20255 | 0.0596% |
| 15 | USD_PLN | 3.62096 | 0.0609% |
| 16 | XAG_USD | 87.60353 | 0.0619% |
| 17 | SG30_SGD | 455.54287 | 0.0628% |
| 18 | XAG_CAD | 121.65159 | 0.0633% |
| 19 | XAG_HKD | 683.08229 | 0.0639% |
| 20 | XAG_NZD | 152.22512 | 0.0645% |
| 21 | XAG_AUD | 130.83888 | 0.0646% |
| 22 | XAG_EUR | 75.25739 | 0.0646% |
| 23 | WTICO_USD | 59.70949 | 0.0653% |
| 24 | XAG_JPY | 13863.34068 | 0.0658% |
| 25 | BCO_USD | 64.20095 | 0.0660% |
| 26 | XAG_GBP | 65.25238 | 0.0671% |
| 27 | XAG_SGD | 112.74611 | 0.0679% |
| 28 | XAG_CHF | 70.07482 | 0.0680% |
| 29 | USD_ZAR | 16.41356 | 0.0721% |
| 30 | EUR_ZAR | 19.10545 | 0.0778% |
| 31 | EUR_HUF | 385.94055 | 0.0789% |
Tier 4: Expensive (0.08% - 0.15% spread)
| Rank | Instrument | Avg Price | Spread % |
|---|---|---|---|
| 1 | GBP_ZAR | 22.03469 | 0.0820% |
| 2 | CHF_ZAR | 20.51965 | 0.0826% |
| 3 | USD_THB | 31.37265 | 0.0852% |
| 4 | USD_HUF | 331.56264 | 0.0862% |
| 5 | GBP_PLN | 4.86098 | 0.0925% |
| 6 | ETH_USD | 3223.55429 | 0.1011% |
| 7 | XAU_XAG | 52.60388 | 0.1384% |
| 8 | XPT_USD | 2315.07131 | 0.1429% |
Tier 5: Very Expensive (> 0.15% spread)
| Rank | Instrument | Avg Price | Spread % |
|---|---|---|---|
| 1 | ZAR_JPY | 9.64459 | 0.1557% |
| 2 | SOYBN_USD | 10.42852 | 0.1691% |
| 3 | SUGAR_USD | 0.14727 | 0.1714% |
| 4 | WHEAT_USD | 5.04184 | 0.2023% |
| 5 | NATGAS_USD | 3.36502 | 0.2162% |
| 6 | CORN_USD | 4.25851 | 0.2356% |
| 7 | XPD_USD | 1848.37674 | 0.2360% |
| 8 | BCH_USD | 608.65101 | 0.2733% |
| 9 | TRY_JPY | 3.64477 | 0.3265% |
| 10 | LTC_USD | 75.50976 | 0.7206% |
Category Breakdown
Major Forex Pairs
| Instrument | Spread % | Rank |
|---|---|---|
| USD_JPY | 0.0119% | #6 |
| USD_CAD | 0.0146% | #9 |
| EUR_USD | 0.0150% | #10 |
| GBP_USD | 0.0175% | #15 |
| AUD_USD | 0.0216% | #32 |
| USD_CHF | 0.0223% | #35 |
| NZD_USD | 0.0282% | #58 |
Cross Pairs
| Instrument | Spread % | Rank |
|---|---|---|
| EUR_JPY | 0.0176% | #16 |
| EUR_GBP | 0.0196% | #21 |
| GBP_JPY | 0.0213% | #29 |
| EUR_CAD | 0.0217% | #33 |
| GBP_CAD | 0.0256% | #50 |
| EUR_AUD | 0.0257% | #51 |
| AUD_JPY | 0.0265% | #53 |
| AUD_NZD | 0.0272% | #55 |
| GBP_AUD | 0.0318% | #64 |
| NZD_JPY | 0.0350% | #68 |
| EUR_NZD | 0.0378% | #76 |
| GBP_NZD | 0.0440% | #83 |
Stock Indices
| Instrument | Spread % | Rank |
|---|---|---|
| US30_USD | 0.0059% | #1 |
| SPX500_USD | 0.0069% | #3 |
| NAS100_USD | 0.0074% | #4 |
| DE30_EUR | 0.0142% | #8 |
| US2000_USD | 0.0150% | #11 |
| UK100_GBP | 0.0185% | #19 |
| FR40_EUR | 0.0186% | #20 |
| JP225Y_JPY | 0.0198% | #22 |
| EU50_EUR | 0.0209% | #27 |
| HK33_HKD | 0.0223% | #34 |
| JP225_USD | 0.0250% | #48 |
| AU200_AUD | 0.0293% | #59 |
| CN50_USD | 0.0538% | #91 |
Gold (XAU)
| Instrument | Spread % | Rank |
|---|---|---|
| XAU_HKD | 0.0201% | #23 |
| XAU_CAD | 0.0211% | #28 |
| XAU_EUR | 0.0216% | #31 |
| XAU_JPY | 0.0228% | #37 |
| XAU_USD | 0.0229% | #38 |
| XAU_GBP | 0.0236% | #42 |
| XAU_AUD | 0.0237% | #43 |
| XAU_SGD | 0.0243% | #45 |
| XAU_CHF | 0.0250% | #47 |
| XAU_NZD | 0.0255% | #49 |
| XAU_XAG | 0.1384% | #116 |
Silver (XAG)
| Instrument | Spread % | Rank |
|---|---|---|
| XAG_USD | 0.0619% | #94 |
| XAG_CAD | 0.0633% | #96 |
| XAG_HKD | 0.0639% | #97 |
| XAG_NZD | 0.0645% | #98 |
| XAG_AUD | 0.0646% | #99 |
| XAG_EUR | 0.0646% | #100 |
| XAG_JPY | 0.0658% | #102 |
| XAG_GBP | 0.0671% | #104 |
| XAG_SGD | 0.0679% | #105 |
| XAG_CHF | 0.0680% | #106 |
Crypto
| Instrument | Spread % | Rank |
|---|---|---|
| BTC_USD | 0.0474% | #87 |
| ETH_USD | 0.1011% | #115 |
| BCH_USD | 0.2733% | #125 |
| LTC_USD | 0.7206% | #127 |
Commodities
| Instrument | Spread % | Rank |
|---|---|---|
| XCU_USD | 0.0373% | #74 |
| WTICO_USD | 0.0653% | #101 |
| BCO_USD | 0.0660% | #103 |
| XPT_USD | 0.1429% | #117 |
| SOYBN_USD | 0.1691% | #119 |
| SUGAR_USD | 0.1714% | #120 |
| WHEAT_USD | 0.2023% | #121 |
| NATGAS_USD | 0.2162% | #122 |
| CORN_USD | 0.2356% | #123 |
| XPD_USD | 0.2360% | #124 |
Key Insights
- US Stock Indices are cheapest to trade - US30, SPX500, and NAS100 all have spreads under 0.01%
- Major forex pairs are very efficient - All majors are under 0.03%, with USD/JPY best at 0.012%
- Gold is surprisingly cheap - XAU pairs average around 0.02-0.025%, comparable to forex crosses
- Silver is 3x more expensive than gold - XAG pairs average around 0.06-0.07%
- Avoid LTC_USD - At 0.72% spread, it's the most expensive instrument
- Crypto varies wildly - BTC (0.047%) is 15x cheaper than LTC (0.72%)
- Agricultural commodities are expensive - Corn, wheat, soybeans all > 0.15%
Recommendations
For Scalping (frequent trades)
Stick to Tier 1 instruments only:
- US indices (US30, SPX500, NAS100)
- Major forex (USD/JPY, EUR/USD, USD/CAD)
For Swing Trading (fewer trades)
Tier 1-3 instruments are acceptable:
- All major and minor forex pairs
- Gold (any XAU pair)
- Major indices
Avoid for Active Trading
- LTC_USD, BCH_USD
- Agricultural commodities (CORN, WHEAT, SOYBN)
- Exotic currency pairs with ZAR, TRY, PLN
Data based on one week of hourly candles from OANDA practice environment. Generated: January 2026
Steep Neckline Take Profit (Experimental)
Status: Experimental rule - tracking results to validate
The Problem
When the neckline slopes steeply against the trade direction, the standard take profit (measured move to opposite neckline) often doesn't get hit. Price tends to reverse earlier.
The Rule
When the neckline is steep against the trade direction, only expect a retracement to 0.618 of the distance between the necklines.
Identifying "Steep Against"
- H&S (short): Neckline slopes DOWN (left neckline higher than right neckline)
- iH&S (long): Neckline slopes UP (left neckline lower than right neckline)
In both cases, the neckline angle works against reaching the full measured move target.
Example: AUD/HKD H&S

In this H&S pattern:
- The neckline slopes downward (against the short trade)
- Standard TP would be at the 1.0 or beyond level
- Price only reached approximately the 0.618 level before reversing
- Entry at neckline retest coincided with the 0.618 retracement zone
Application
- Measure the distance between left neckline and right neckline
- Apply Fibonacci retracement from head to right neckline
- Set TP at the 0.618 level instead of the full measured move
- This gives a more conservative but higher probability target
When to Use
- Neckline has a noticeable slope against trade direction
- Consider using 0.618 TP for first target, with runner to full TP
- Especially relevant on lower timeframes (M15, H1) where momentum fades faster
Tracking
Document trades where this rule applies to validate its effectiveness over time.
Pattern Analysis & Scoring System
This chapter analyzes Head & Shoulders (H&S) and Inverted H&S (iH&S) trades to identify correlations between pattern characteristics and win rate, then provides a scoring system for pre-trade evaluation.
Caveat: Sample Size
Warning: This analysis is based on approximately 10 trades. Results are preliminary and should be refined as more trade data becomes available. Use this as a starting framework, not gospel.
Trade Data Summary
| # | Instrument | Pattern | Outcome | LS Depth | RS Depth | LS-RS Sym | Neckline Tilt | Width Sym | Sentiment |
|---|---|---|---|---|---|---|---|---|---|
| L1 | EURGBP | QH&S | Loss | 96.8% | 94.1% | 2.7% | 18.0% | 1.64 | Against |
| L2 | GBPJPY | iH&S | Loss | — | — | — | — | — | Against |
| L3 | AUDHKD | H&S | Win | — | — | — | — | — | Neutral |
| NT1 | HKDJPY | iH&S | Win | 78.7% | 90.4% | 11.7% | 41.8% | 0.73 | Neutral |
| NT2 | XAUHKD | H&S | Loss | 66.4% | 84.0% | 17.7% | 24.0% | 0.63 | Neutral |
| NT3 | XAUJPY | H&S | Win | 79.6% | 86.2% | 6.6% | 10.3% | 1.47 | Mixed |
| NT4 | CHFJPY | QH&S | Win | 77.3% | 70.6% | 6.7% | 28.1% | 0.74 | Neutral |
| NT9 | NZD/HKD | H&S | Win | 91.6% | 84.1% | 7.5% | 27.7% | — | Bullish |
L = Live trades, NT = Not Taken (tracked but not executed)
Analysis by Metric
Shoulder Depth
Theory: Textbook H&S patterns have shoulders at ~50% of the head depth. Shallower shoulders may indicate weaker reversal conviction.
Findings:
- Wins: 78.7%, 79.6%, 77.3%, 91.6% (avg ~82%)
- Losses: 96.8%, 66.4% (avg ~82%)
Conclusion: No significant difference observed. Most shoulders in our sample are 70-90% deep regardless of outcome. The 50% textbook ideal may not apply to real-world trading, or sample size is too small. Not a reliable filter yet.
Shoulder Symmetry (LS vs RS Depth Difference)
Theory: More symmetrical shoulders indicate a cleaner pattern. Lower percentage = more symmetrical.
Findings:
- Wins: 11.7%, 6.6%, 6.7%, 7.5% (avg ~8%)
- Losses: 2.7%, 17.7% (avg ~10%)
Conclusion: Winners have slightly better symmetry on average. However, the best symmetry (2.7%) was a loss, and 11.7% was a win. Weak signal - needs more data.
Neckline Tilt
Theory: Flatter necklines are more reliable. Steep necklines suggest the pattern may be part of a continuing trend rather than a reversal.
Findings:
- Wins: 41.8%, 10.3%, 28.1%, 27.7% (avg ~27%)
- Losses: 18.0%, 24.0% (avg ~21%)
Conclusion: Counter-intuitive result - losses had FLATTER necklines on average. This contradicts theory but sample is tiny. Inconclusive - possibly inverted correlation or noise.
Width Symmetry
Theory: The pattern should be roughly symmetrical in time (left side ≈ right side). Ratio of 1.0 is perfect; 0.6-1.4 is acceptable range.
Findings:
- Wins: 0.73, 1.47, 0.74 (avg ~0.98)
- Losses: 1.64, 0.63 (avg ~1.14)
Conclusion: Winners are closer to symmetrical on average. Loss patterns show more extreme asymmetry. Moderate signal - stay within 0.6-1.4 range.
Sentiment Alignment
Theory: Trading with or neutral to market sentiment improves win rate. Trading against sentiment increases risk.
Findings:
- Wins: Neutral (3), Mixed (1), Bullish (1) - aligned or neutral
- Losses: Against (2), Neutral (1) - two of three traded against sentiment
Conclusion: STRONGEST SIGNAL in this dataset. Both "Against" sentiment trades were losses. Trading against sentiment appears to be a significant risk factor.
Pre-Trade Scoring System (v2)
A psychological decision-support tool for evaluating H&S trades BEFORE entry. Score setups objectively to compare quality and avoid emotional decisions.
Data Sources
From H&S Tool Screenshot (7 points):
- Run-up start - Bottom of prior move (iH&S) / Top of prior move (H&S)
- Left Shoulder (LS) - Price + bar
- Left Neckline (LN) - Price + bar
- Head - Price + bar
- Right Neckline (RN) - Price + bar
- Right Shoulder (RS) - Price + bar
- Entry candle - Bottom (long) / Top (short) + bar
From OANDA MCP:
- Candle OHLC data for ATR calculations
- Break candle and entry candle ranges
From User:
- Instrument, timeframe
- Screenshot link
- RSI divergence (yes/no)
- Roadblock zone (none/1/2/3)
- Break candle bar number
- Sentiment
Calculated Metrics
From Pattern Points:
- Shoulder Symmetry = |LS_depth% - RS_depth%|
- Width Symmetry = (RS_bar - Head_bar) / (Head_bar - LS_bar)
- Run-up Ratio = Run-up Size / Head Height
From OANDA:
- ATR(14) = Average True Range of 14 candles before entry
- Break Candle ATRs = Break candle range / ATR
- Entry Candle ATRs = Entry candle range / ATR
Scoring Criteria
| Criterion | Points | Condition |
|---|---|---|
| Sentiment | +1 | Aligned or Neutral |
| RSI Divergence | +1 | Present |
| Shoulder Symmetry | +1 | < 15% difference |
| Width Symmetry | +1 | Ratio 0.6 - 1.4 |
| Break/Close Candle | +1 | ≥ 1.0 ATR |
| Entry Candle | +1 | ≥ 0.5 ATR |
| Roadblock | +1 to -2 | None=+1, Zone3=0, Zone2=-1, Zone1=-2 |
| Run-up Ratio | +1 to -1 | ≥1.5=+1, 1.0-1.5=0, <1.0=-1 |
Score Range: -3 to +8
Grade Definitions
| Grade | Score | Action |
|---|---|---|
| A | 6-8 | Strong setup - take it |
| B | 4-5 | Acceptable - proceed with caution |
| C | 2-3 | Weak - probably skip |
| D | ≤1 | Do not trade |
Pre-Trade Checklist
Before entering any H&S trade, complete this checklist:
Step 1: Pattern Quality
- Sentiment aligned or neutral? (+1 if yes)
- RSI divergence present? (+1 if yes)
- Shoulder symmetry < 15%? (+1 if yes)
- Width symmetry 0.6-1.4? (+1 if yes)
Step 2: Momentum Check
- Break candle ≥ 1.0 ATR? (+1 if yes)
- Entry candle ≥ 0.5 ATR? (+1 if yes)
Step 3: Roadblock Assessment
- No roadblocks in path to TP? (+1)
- Only Zone 3 roadblock? (0)
- Zone 2 roadblock? (-1)
- Zone 1 roadblock? (-2)
Step 4: Run-up Context
- Run-up ratio ≥ 1.5? (+1)
- Run-up ratio 1.0-1.5? (0)
- Run-up ratio < 1.0? (-1)
Step 5: Calculate & Decide
Total Score: _____ / 8
| Your Score | Grade | Decision |
|---|---|---|
| 6-8 | A | Take the trade |
| 4-5 | B | Proceed with caution |
| 2-3 | C | Skip this one |
| ≤1 | D | Do not trade |
Example Evaluation
Trade: GBPUSD H1 iH&S Long
| Criterion | Value | Points |
|---|---|---|
| Sentiment | Neutral | +1 |
| RSI Divergence | Yes | +1 |
| Shoulder Symmetry | 8% | +1 |
| Width Symmetry | 0.85 | +1 |
| Break Candle | 1.3 ATR | +1 |
| Entry Candle | 0.6 ATR | +1 |
| Roadblock | None | +1 |
| Run-up Ratio | 1.8x | +1 |
| Total | 8 (A-grade) |
Decision: Strong setup - take the trade.
Summary
Key Findings:
- Sentiment is critical - Avoid trading against sentiment
- Width symmetry matters - Keep ratio between 0.6-1.4
- Shoulder symmetry helps - Prefer <15% difference
- Shoulder depth - Not a reliable filter (most are 70-90% anyway)
- Neckline tilt - Inconclusive, needs more data
Recommendation: Score every H&S setup before entry using the v2 checklist. Only take A-grade (6-8 points) or B-grade (4-5 points) trades.
Last updated: February 2026 Sample size: ~10 trades Version: 2.0 - Pre-Trade Scoring Checklist