Previous Price Action
- Previous Price Action
- What we'll learn
- Why should you learn this
- If you don't learn it
- Imagine what it will be like when can do this
- 4 Phrases you need to know
- 4 Steps to mastering PPA
- 1. Identify the previous price action
- 2. Assess the price action
- 3. Historical levels of support and resistance
- 4. Inefficient candles
- Being able to assess the Price Action that leads into the H&S pattern will:
- Challenges to mastery
- How can you identify and overcome these barriers?
- When you're mastering this, stay motivated!
- Over time, how can you build consistency ?
- Stages of progress on the way to mastery
What we'll learn
- How to increase the likelihood of Reversal patterns going ot full profit target.
- How to make sure the PPA is long enough to allow the pattern to complete
- Recognize the importance of strong and clean price action leading into the pattern.
- Avoid trading in choppy price action and focus on clear trends.
- Identify historical support and resistance levels between the neckline and target level.
- Discover the potential of inefficient candles below the neckline that can help price reach the target quickly.
- Trade only high quality setups.
- Develop patience and discipline by leaving the uncertain trades and waiting for the next setup.
Why should you learn this
Previous price action is vital when trading a Head and Shoulders pattern.
Why?
- Pattern Validation: it will help you validate the existence of the Head & Shoulders pattern.
- Measuring Target: It will help you estimate the potential price target for the pattern and give you a clue to how quickly & smoothly price will reach this target.
- Support and Resistance Levels: It reveals key support and resistance levels that may influence the Head & Shoulders patterns' outcome. For this, you will be examining how the price reacted to these levels in the past, as they can impact the pattern's reliability and potential reversal areas.
If you don't learn it
You will not be as profitable at trading the H&S patterns if you don't learn how to assess Previous Price Action
How come ?
- You won't be able to identify the most appropriate Take Profit Level.
- You will have little clue as to how price action is likely to behave when it breaks the neckline.
Imagine what it will be like when can do this
Maximize the potential of any H%S or inverted H&S pattern.
Mastering Previous Price Action will allow you to be able to do this.
How?
- By being able to fully identify the most appropriate Take Profit level.
- And having a great insight into how price action is likely to behave when it breaks the neckline.
4 Phrases you need to know
- Clean Price Action: the movement of price on a chart without teh presence of excessive noise, distractions, or false signals.
- This typically indicates a clear and unambiguous trend direction and can be observed in both uptrends and downtrends.
- Choppy Price Action: A market condition where the price movement is characterized by frequent and erratic fluctuations without displaying a clear and sustained trend.
- Squared up: When future price action has retraced at least 50% into the range of a previous candle.
- The vast majority of candles are squared-up.
- candles that aren't squared up are called inefficient candles.
- Inefficient Candle: A candlestick that displays a large body and a disproportionate range between its high and low prices.
- Immediate future price action does not retrace back halfway up (or down) the candle, thereby leaving an imbalanced market. 99.999% of candles are squared up (eventually) by price retracing at least 50% into the range of the candle.
- When this does not happen, it leaves behind a imbalance in the market and the candle is called an inefficient candle.
- Inefficient candles often act as a magnet for price and may indicate potential trading opportunities.
4 Steps to mastering PPA
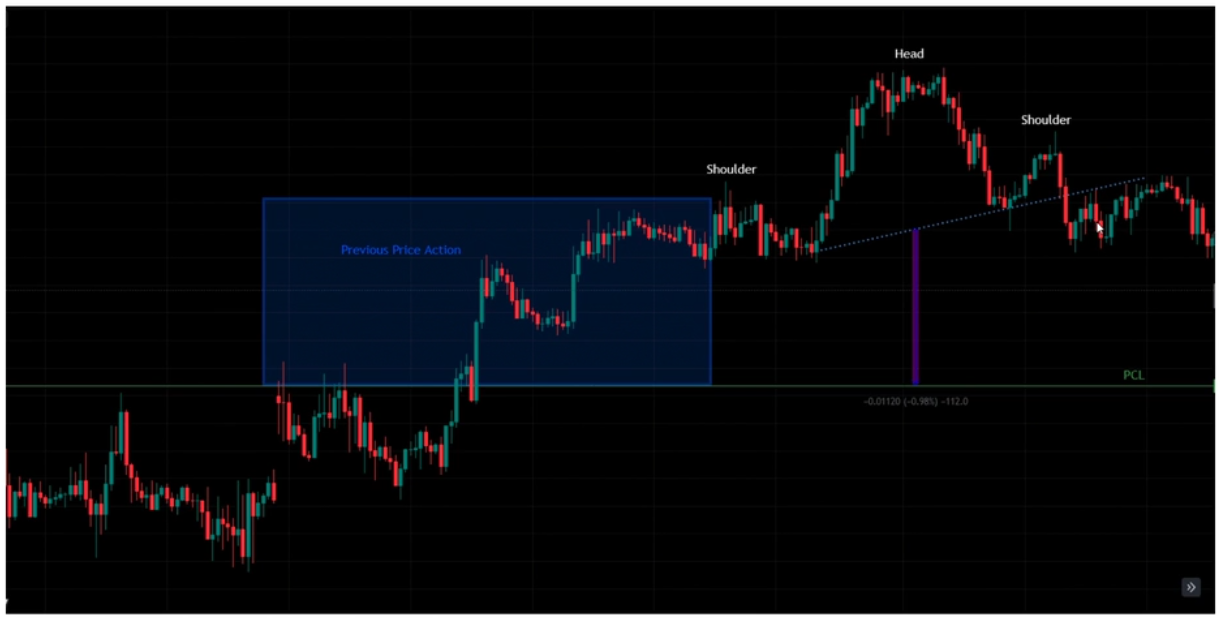
1. Identify the previous price action
We first start by identifying the price action leading into the left shoulder of the H%S pattern.
- The precise area of the chart must be identified in order to make a proper assessment of the relevant price action.
How do you do this?
- Establish the area af price immediately preceding the left shoulder that is between the PCL and the start of the left shoulder.
This will be a move up in price for a H&S pattern, or a move down in price for an inverted H&S pattern.
2. Assess the price action
This is key ot establishing whether the desirable price action is in evidence.
How do you do this ?
- Visually asses the price action between the PCL and the left shoulder to see if it is clean (desirable), choppy (undesirable) or in-between (not ideal, but still tradeable with caution).
3. Historical levels of support and resistance
Now we will identify areas of price action that may have historical levels of support and resistance.
- it is necessary to be able to identify potential level of support and resistance, between the neckline and PCL that may provide a block to price preaching eth take profit target.
How do you do this?
- Look for areas of price action that break up the clean price trend.
- These can be sideway consolidation areas or pull-backs.
- Look back to see if these areas represent historical levels of S&R
4. Inefficient candles
These are areas of imbalance and are therefore important as they can help price move in the desired direction.
How do you do this ?
Look for a large, big-bodied candle that has not been squared up.
- Squared up refers to a candle where future price action has come back to at least half way back up, or down the candle.
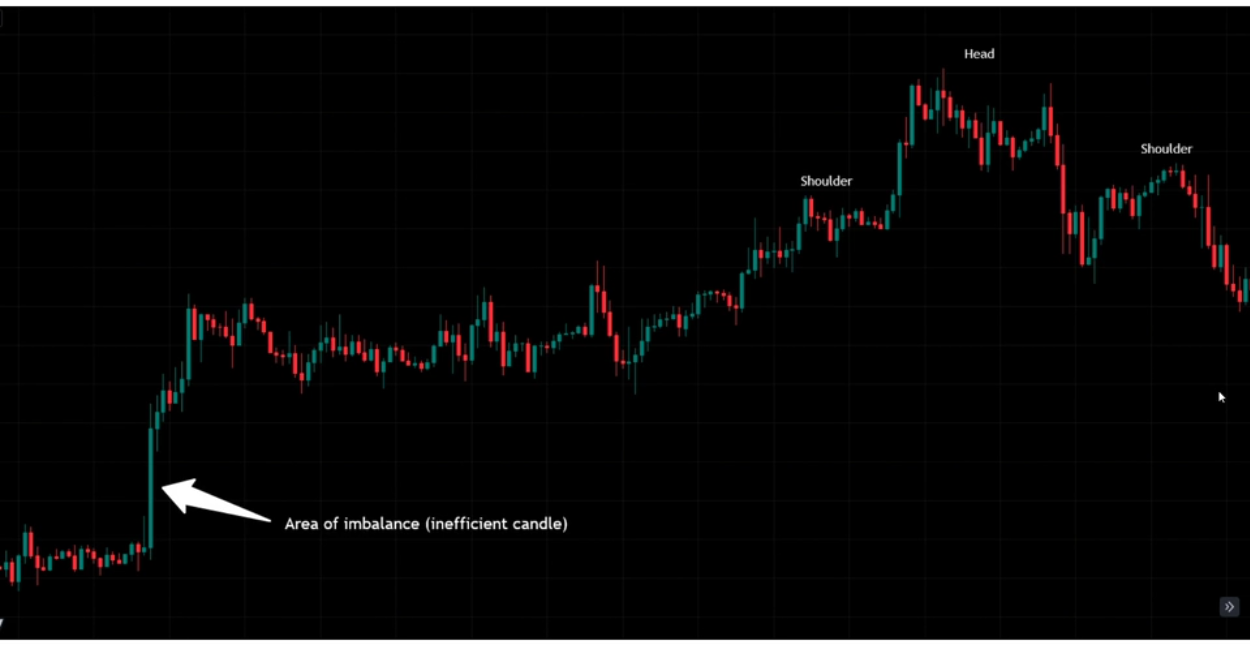
The bigger the candle, the more pulling power it may have.
If you notice an area of S&R blocking your way to take profit, and it's more than half way down, and you still get a good risk to reward ratio (like >= 1.5) then just set the take profit at the top of that area of S&R.
Being able to assess the Price Action that leads into the H&S pattern will:
- Significantly increase your win rate when trading H&S Patters
- Increase your consistency
Challenges to mastery
- You may struggle to be able to asses the price action as being good, bad, or indifferent.
- Not seeing the areas of potential support and resistance.
- Not understanding what an inefficient candle is.
- Lack of belief in the power of Previous Price Action
How can you identify and overcome these barriers?
(You can identify these barriers by seeing trades repeatedly reverse an themselves before going to target.
And you can overcome the by practicing with bar replay.
- When a H&S form, asseS the PPA and make judgement whether you would trade the pattern or not, then observe the result
When you're mastering this, stay motivated!
A few things to remember are..
- That you are not on your own, and everyone will struggle at the start.
- There will be a steep learning curve.
- It is a process and like anything, it will take time to master, so be patient and don't expect too much too soon.
Over time, how can you build consistency ?
Practice with your best friend: bar replay.
When a H&S pattern forms:
- Asses the PPA
- Decide whether you would trade the pattern or not.
- Observe the result.
Stages of progress on the way to mastery
Beginner
- Trades H&S patterns without really paying much attention to the price action.
- looks at PPA, but struggles with interpreting it
- Forgets to look for areas of imbalance and will not always be able to recognise an inefficient candle.
- Struggles to recognise and often forgets to look for potential areas of support and resistance.
Everyone starts off as a beginner.
Intermediate
- Can understand PPA often
- Can usually see inefficient candles
- Mostly remember to investigate S&R levels
Then, you're starting to get this PPA concept figured out.
Remember, keep going! This is a vital step to mastering trading with the H&S pattern and there's still more improvement to be made.
Master
- Always look at PPA and understand it
- Enjoy and understand finding areas of imbalance.
- Quickly recognise all relevant inefficient candles.
- You have a comprehensive understanding of what specific price action warrants, further support & resistance investigation.
Congratulations!
You can use PPA with confidence in your strategy toolbox.